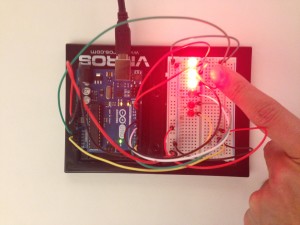
This tutorial describes how to control two sets of multiple LEDs using two photo resistor sensors. This is a lab responsive to different light conditions in one setting so as for lights to react appropriately to its particular conditions. This procedure will define how to set up an array of lights and how to adjust them into two groups for each to respond to its particular light resistor reading. In essence, the overall goal will be to achieve responsive lighting as an effect of multiple data collections.
The parts list:
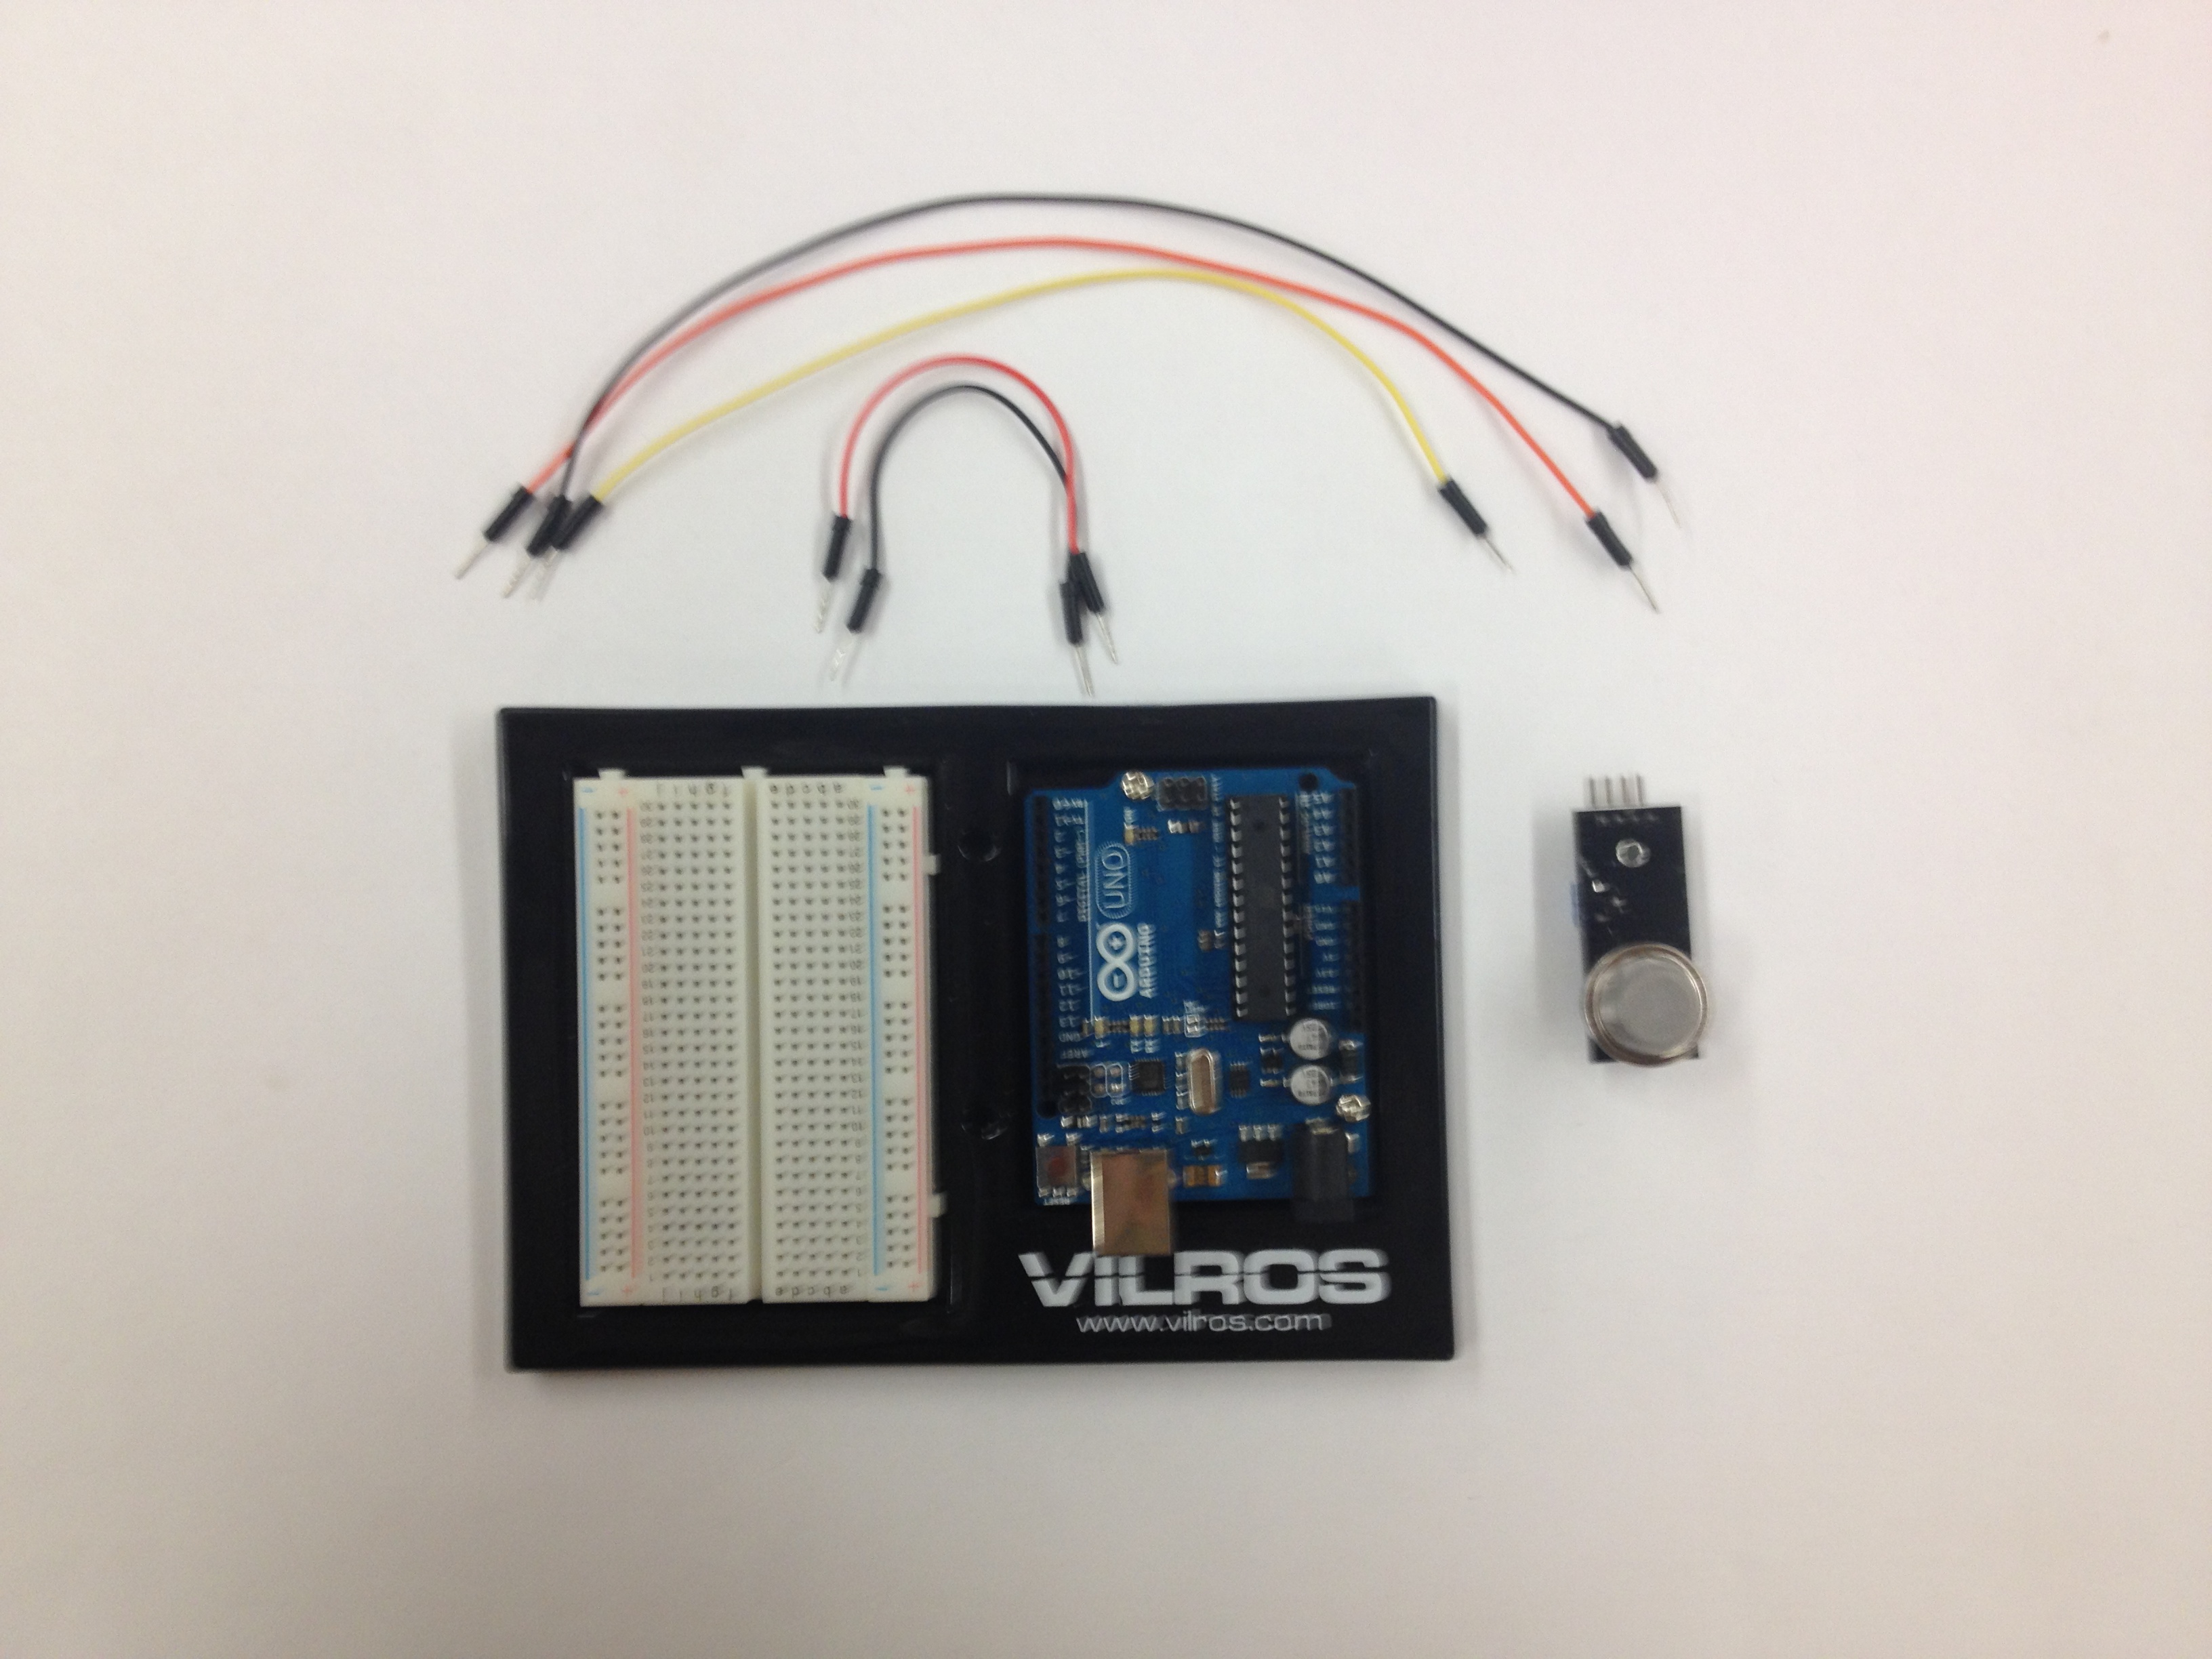
1. Arduino UNO
2. 6 LED lights
3. 6 330 Ohm Resistors
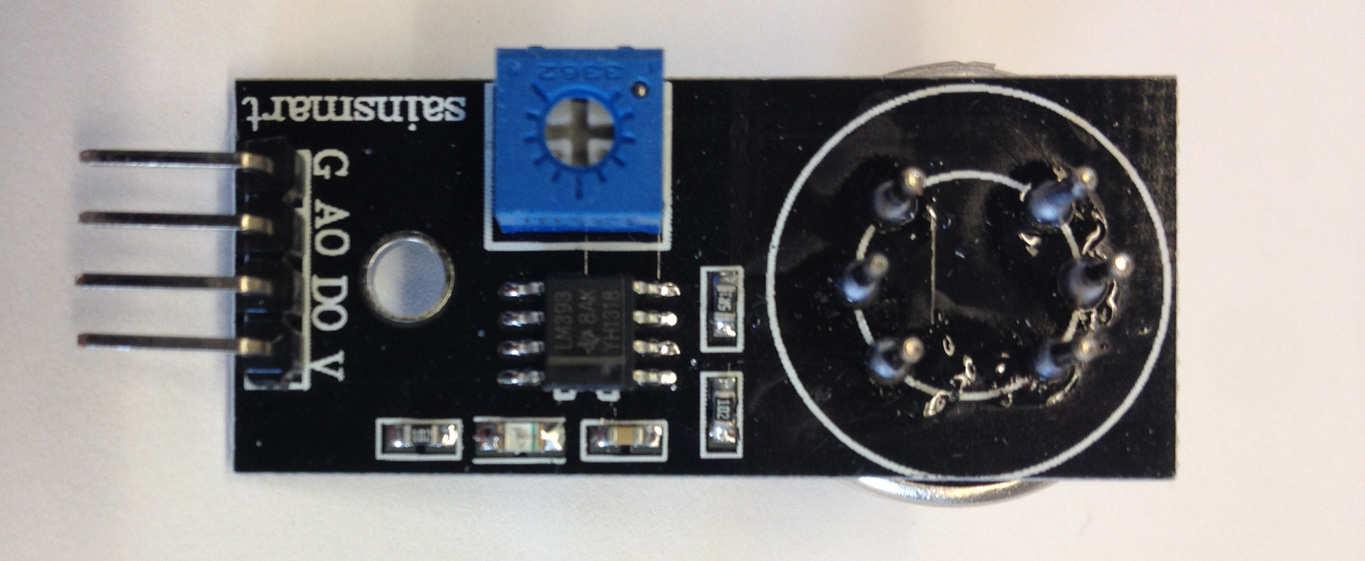
4. 2 Photo Resistors
5. 2 10k Ohm resistors
6. Jumper Wires
Step 1 Setting LED’s
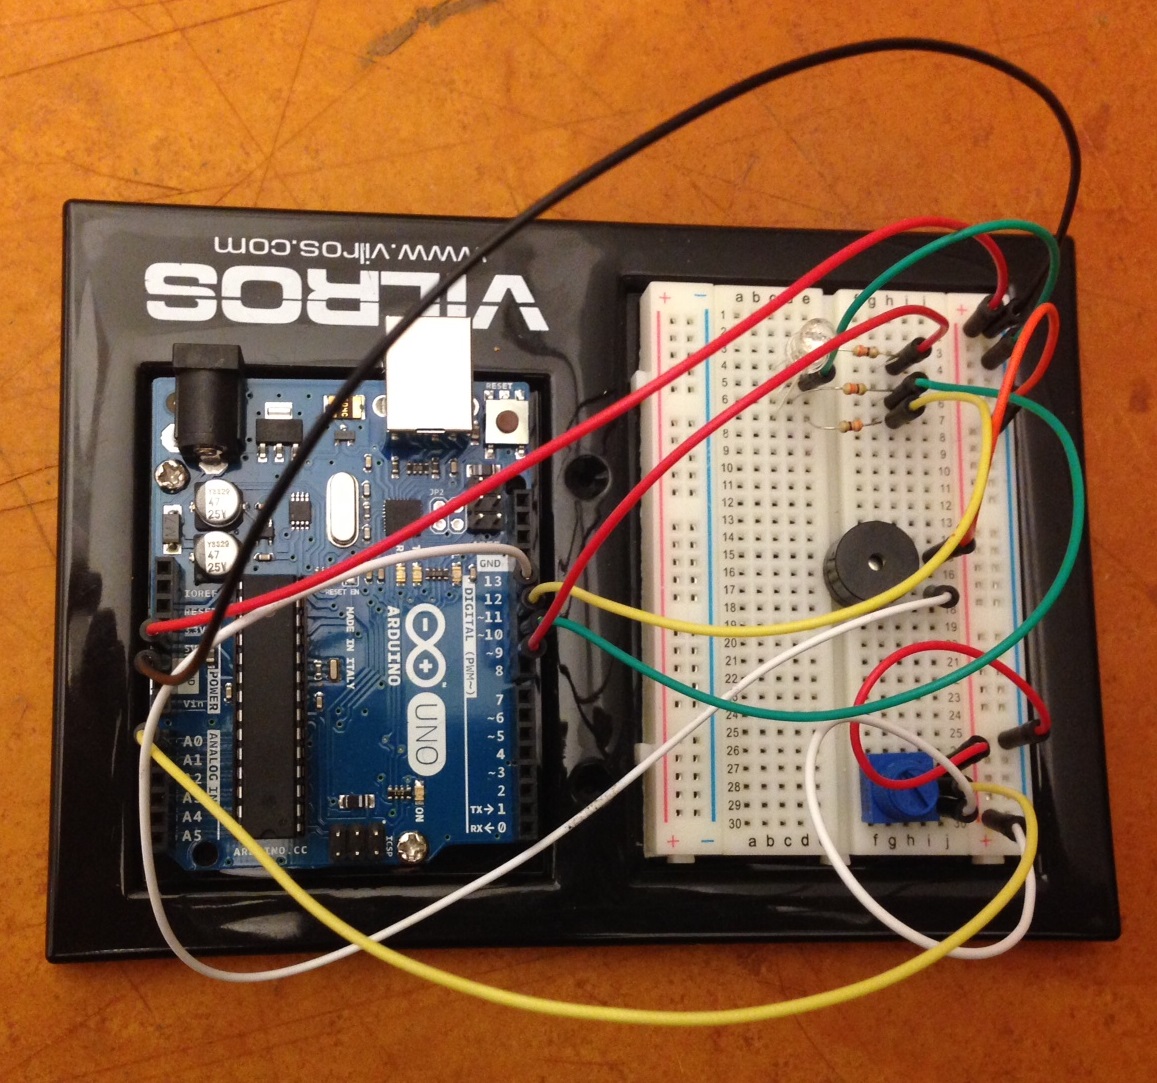
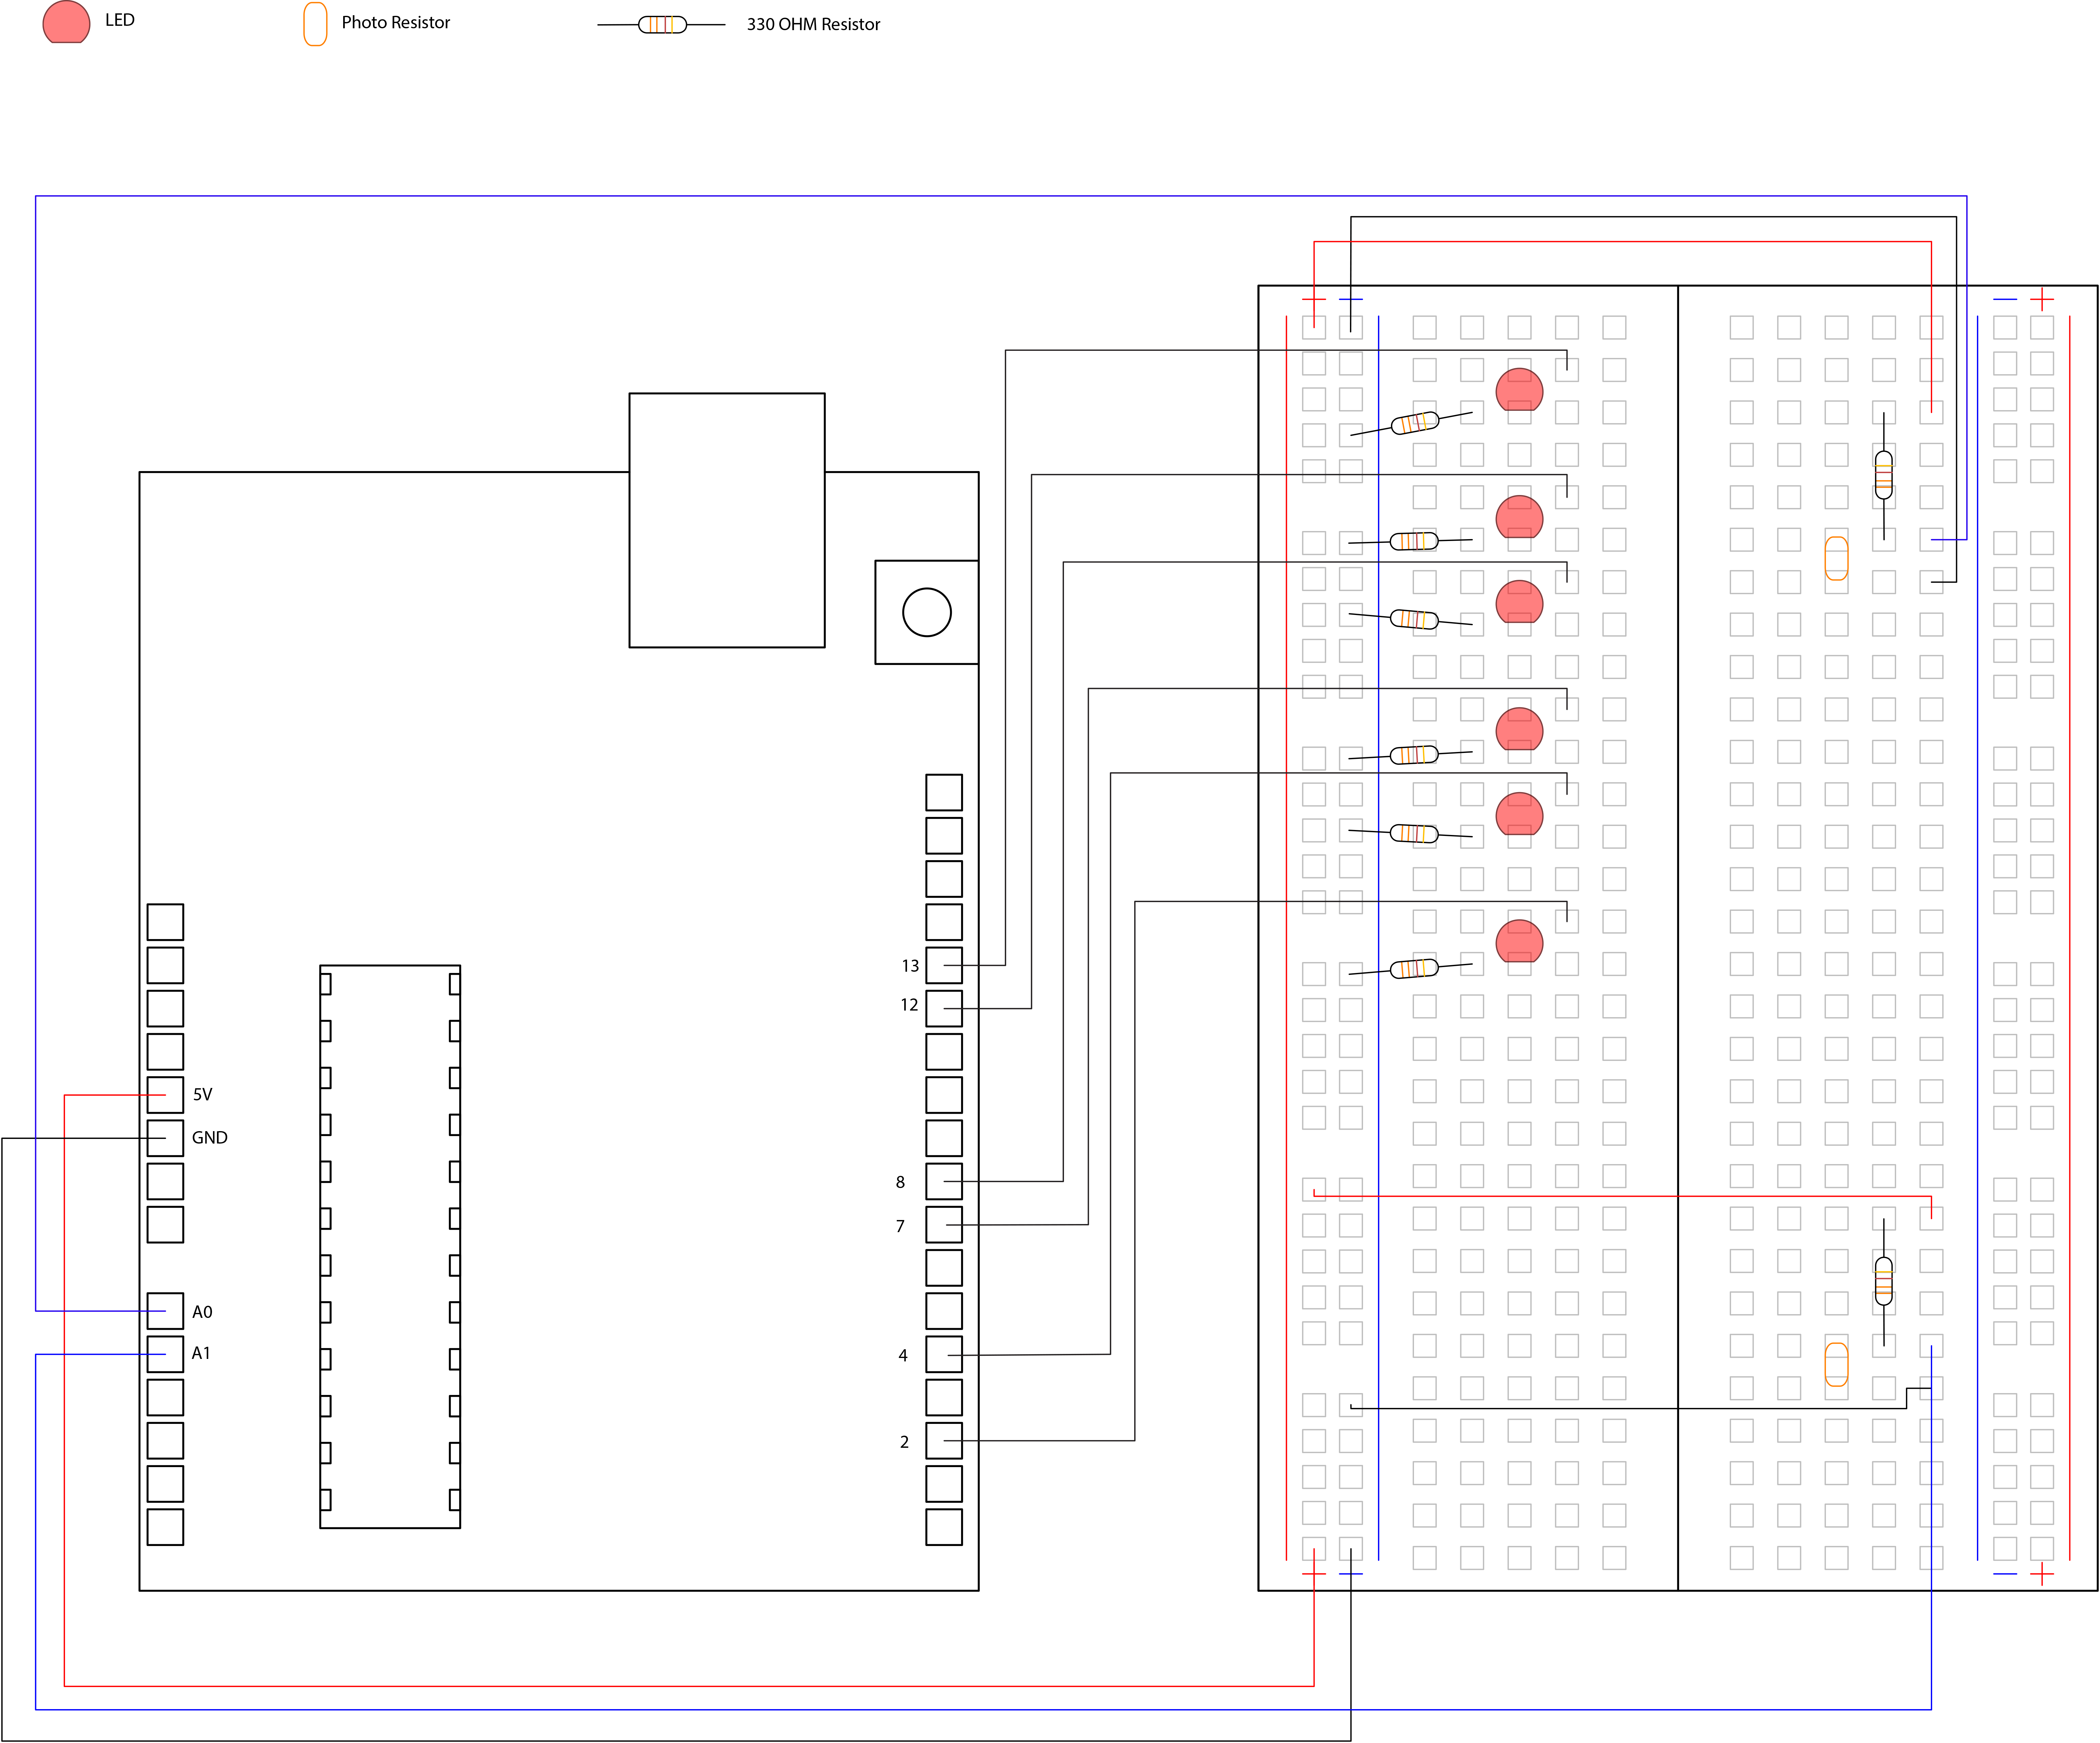
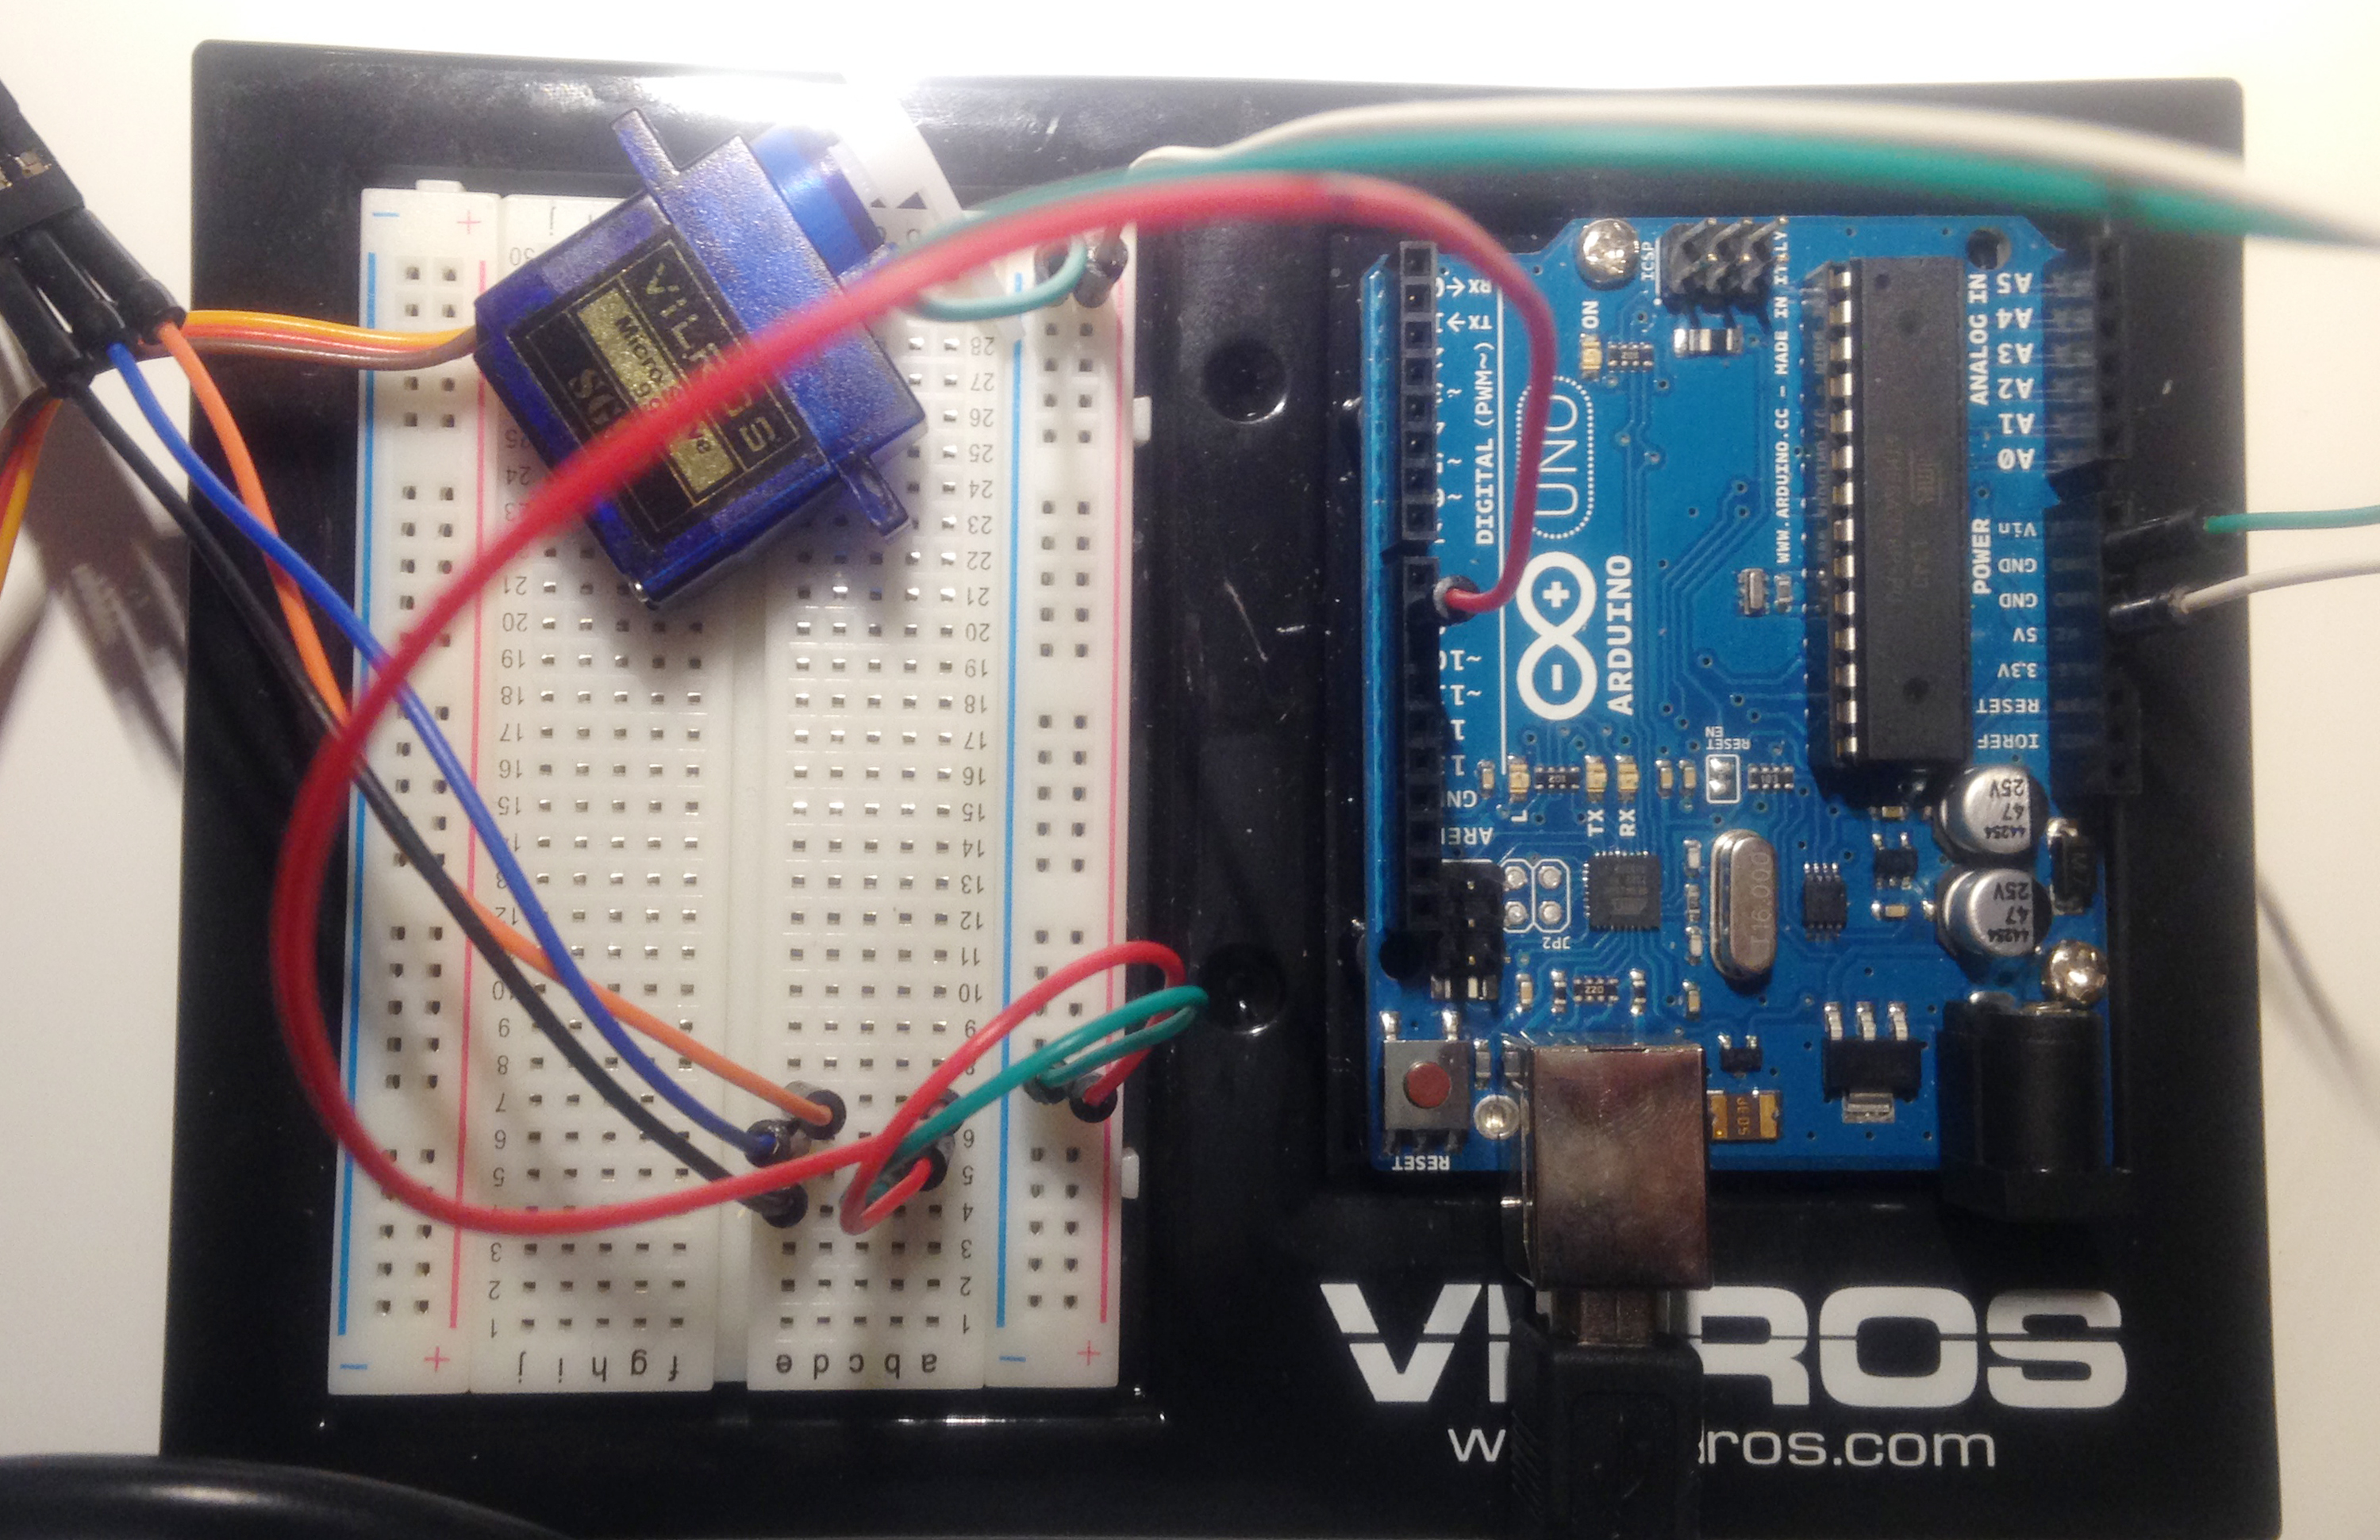
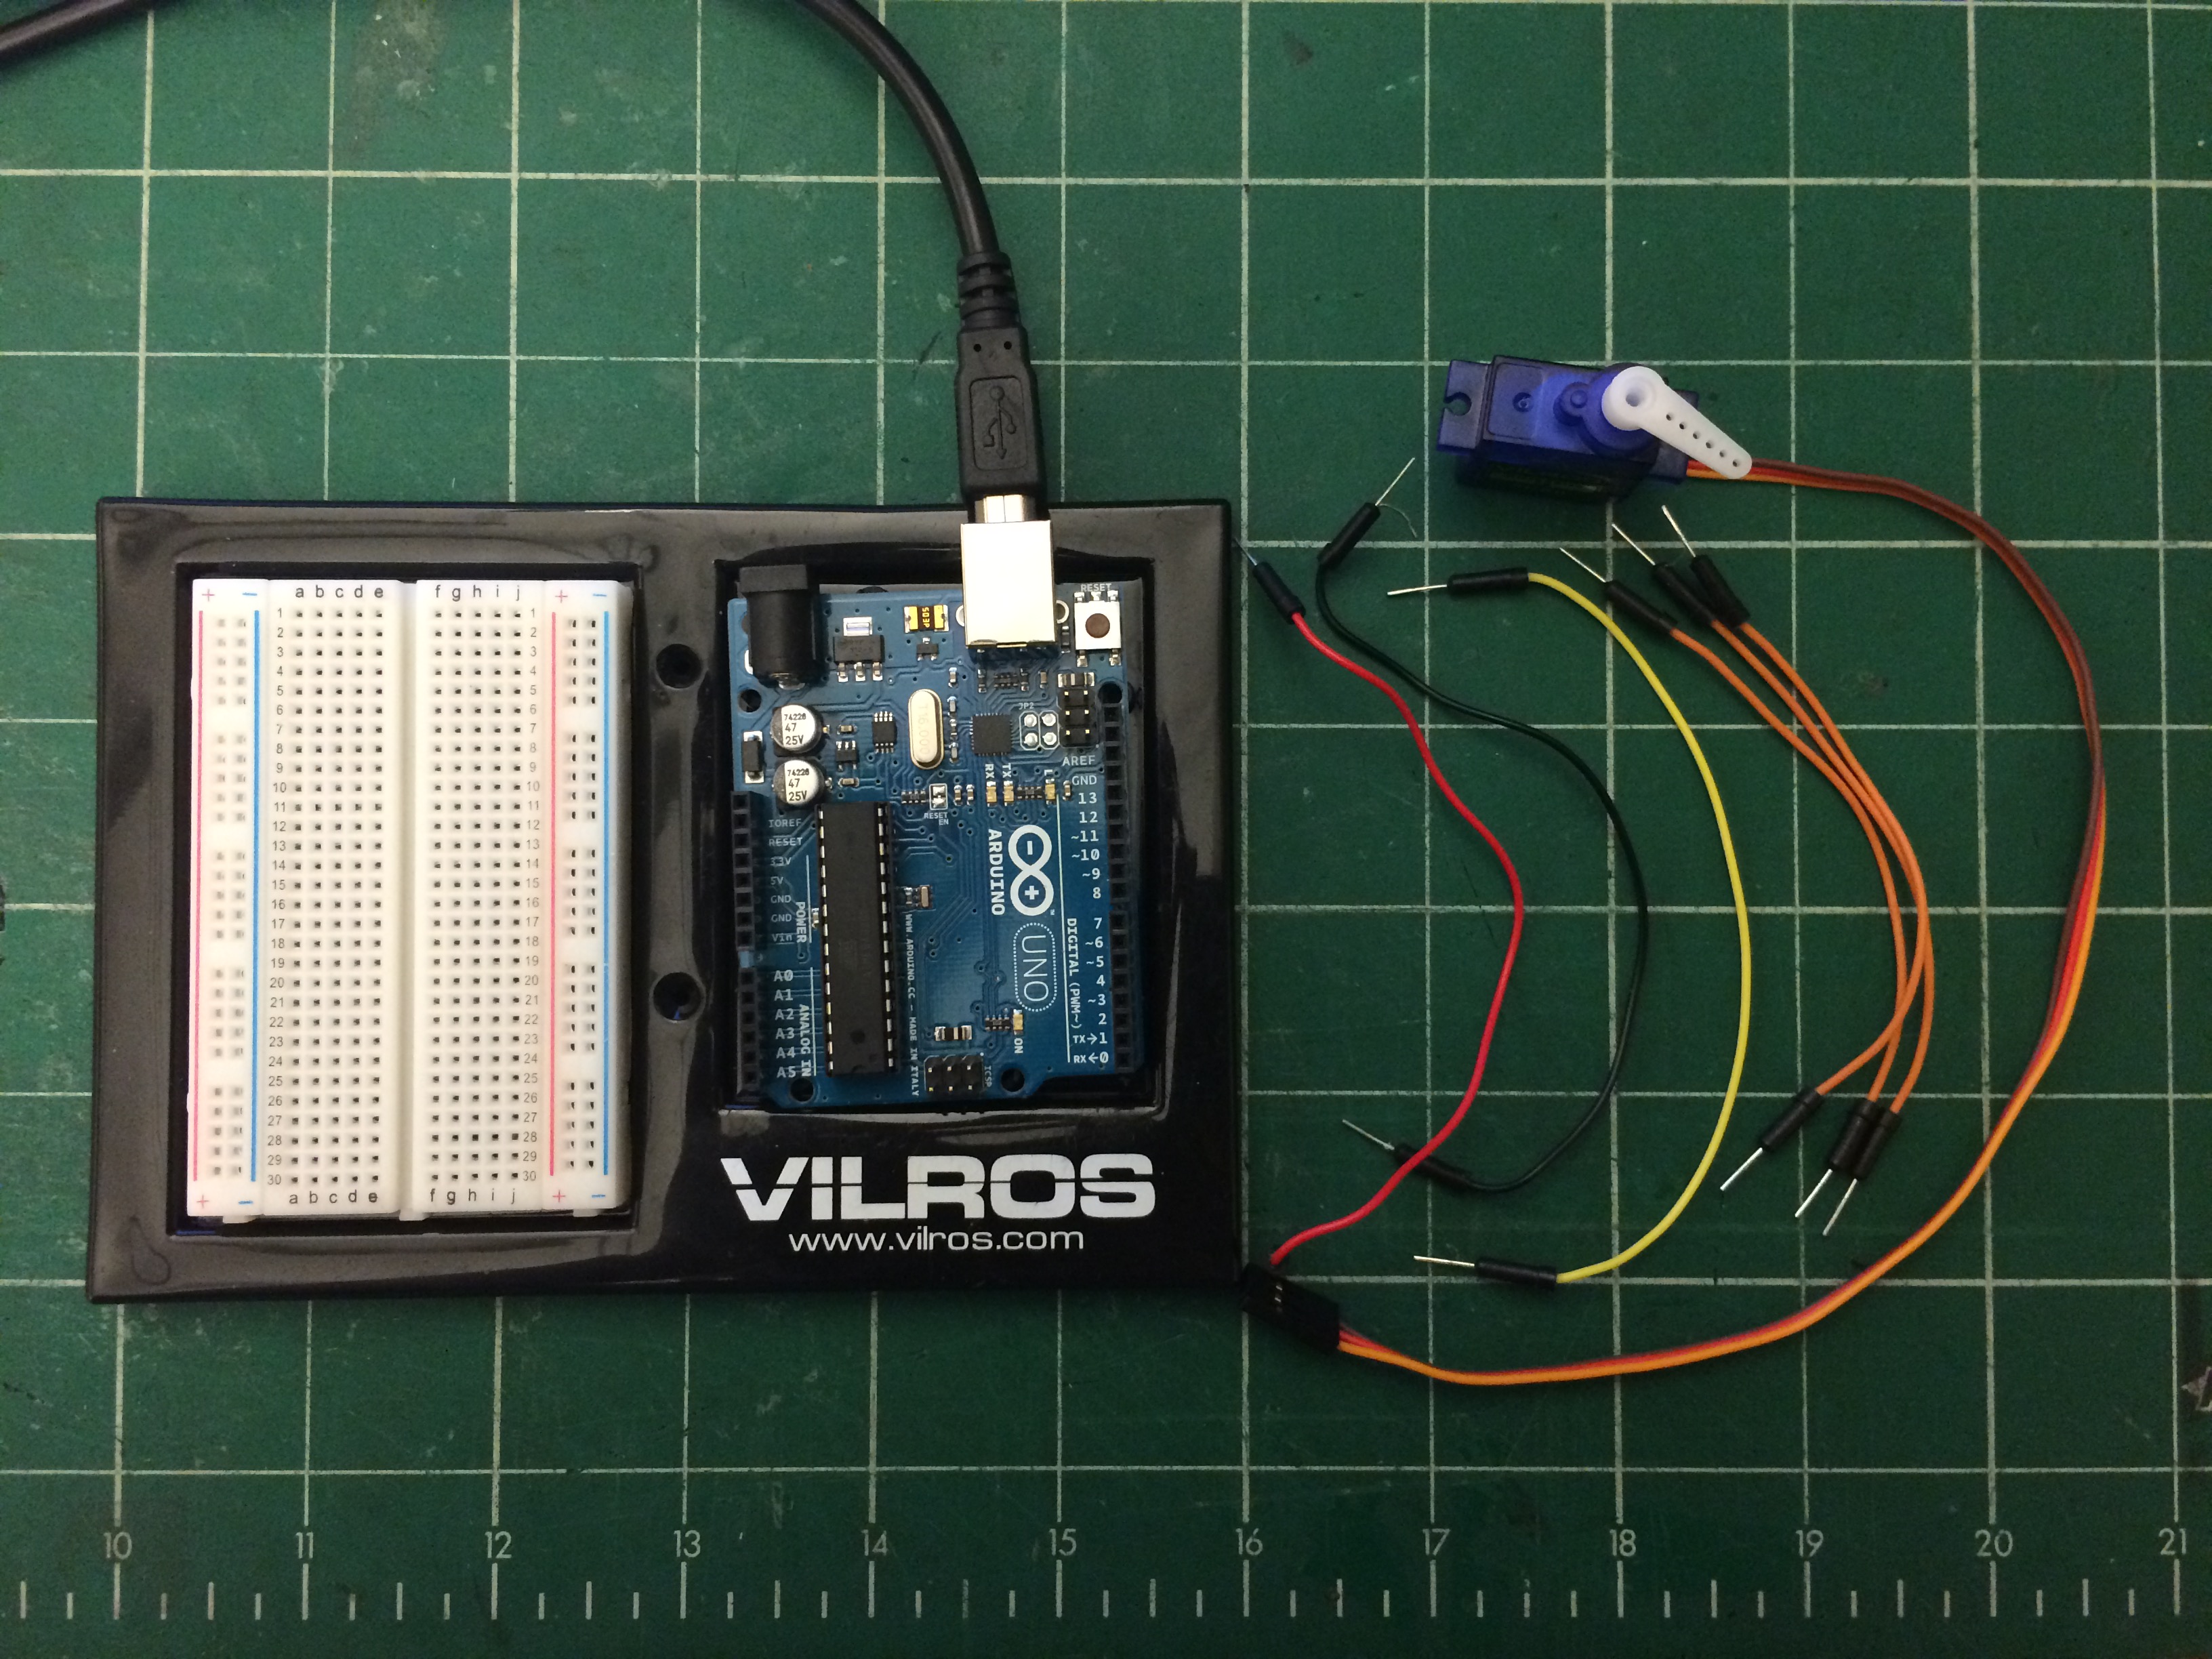
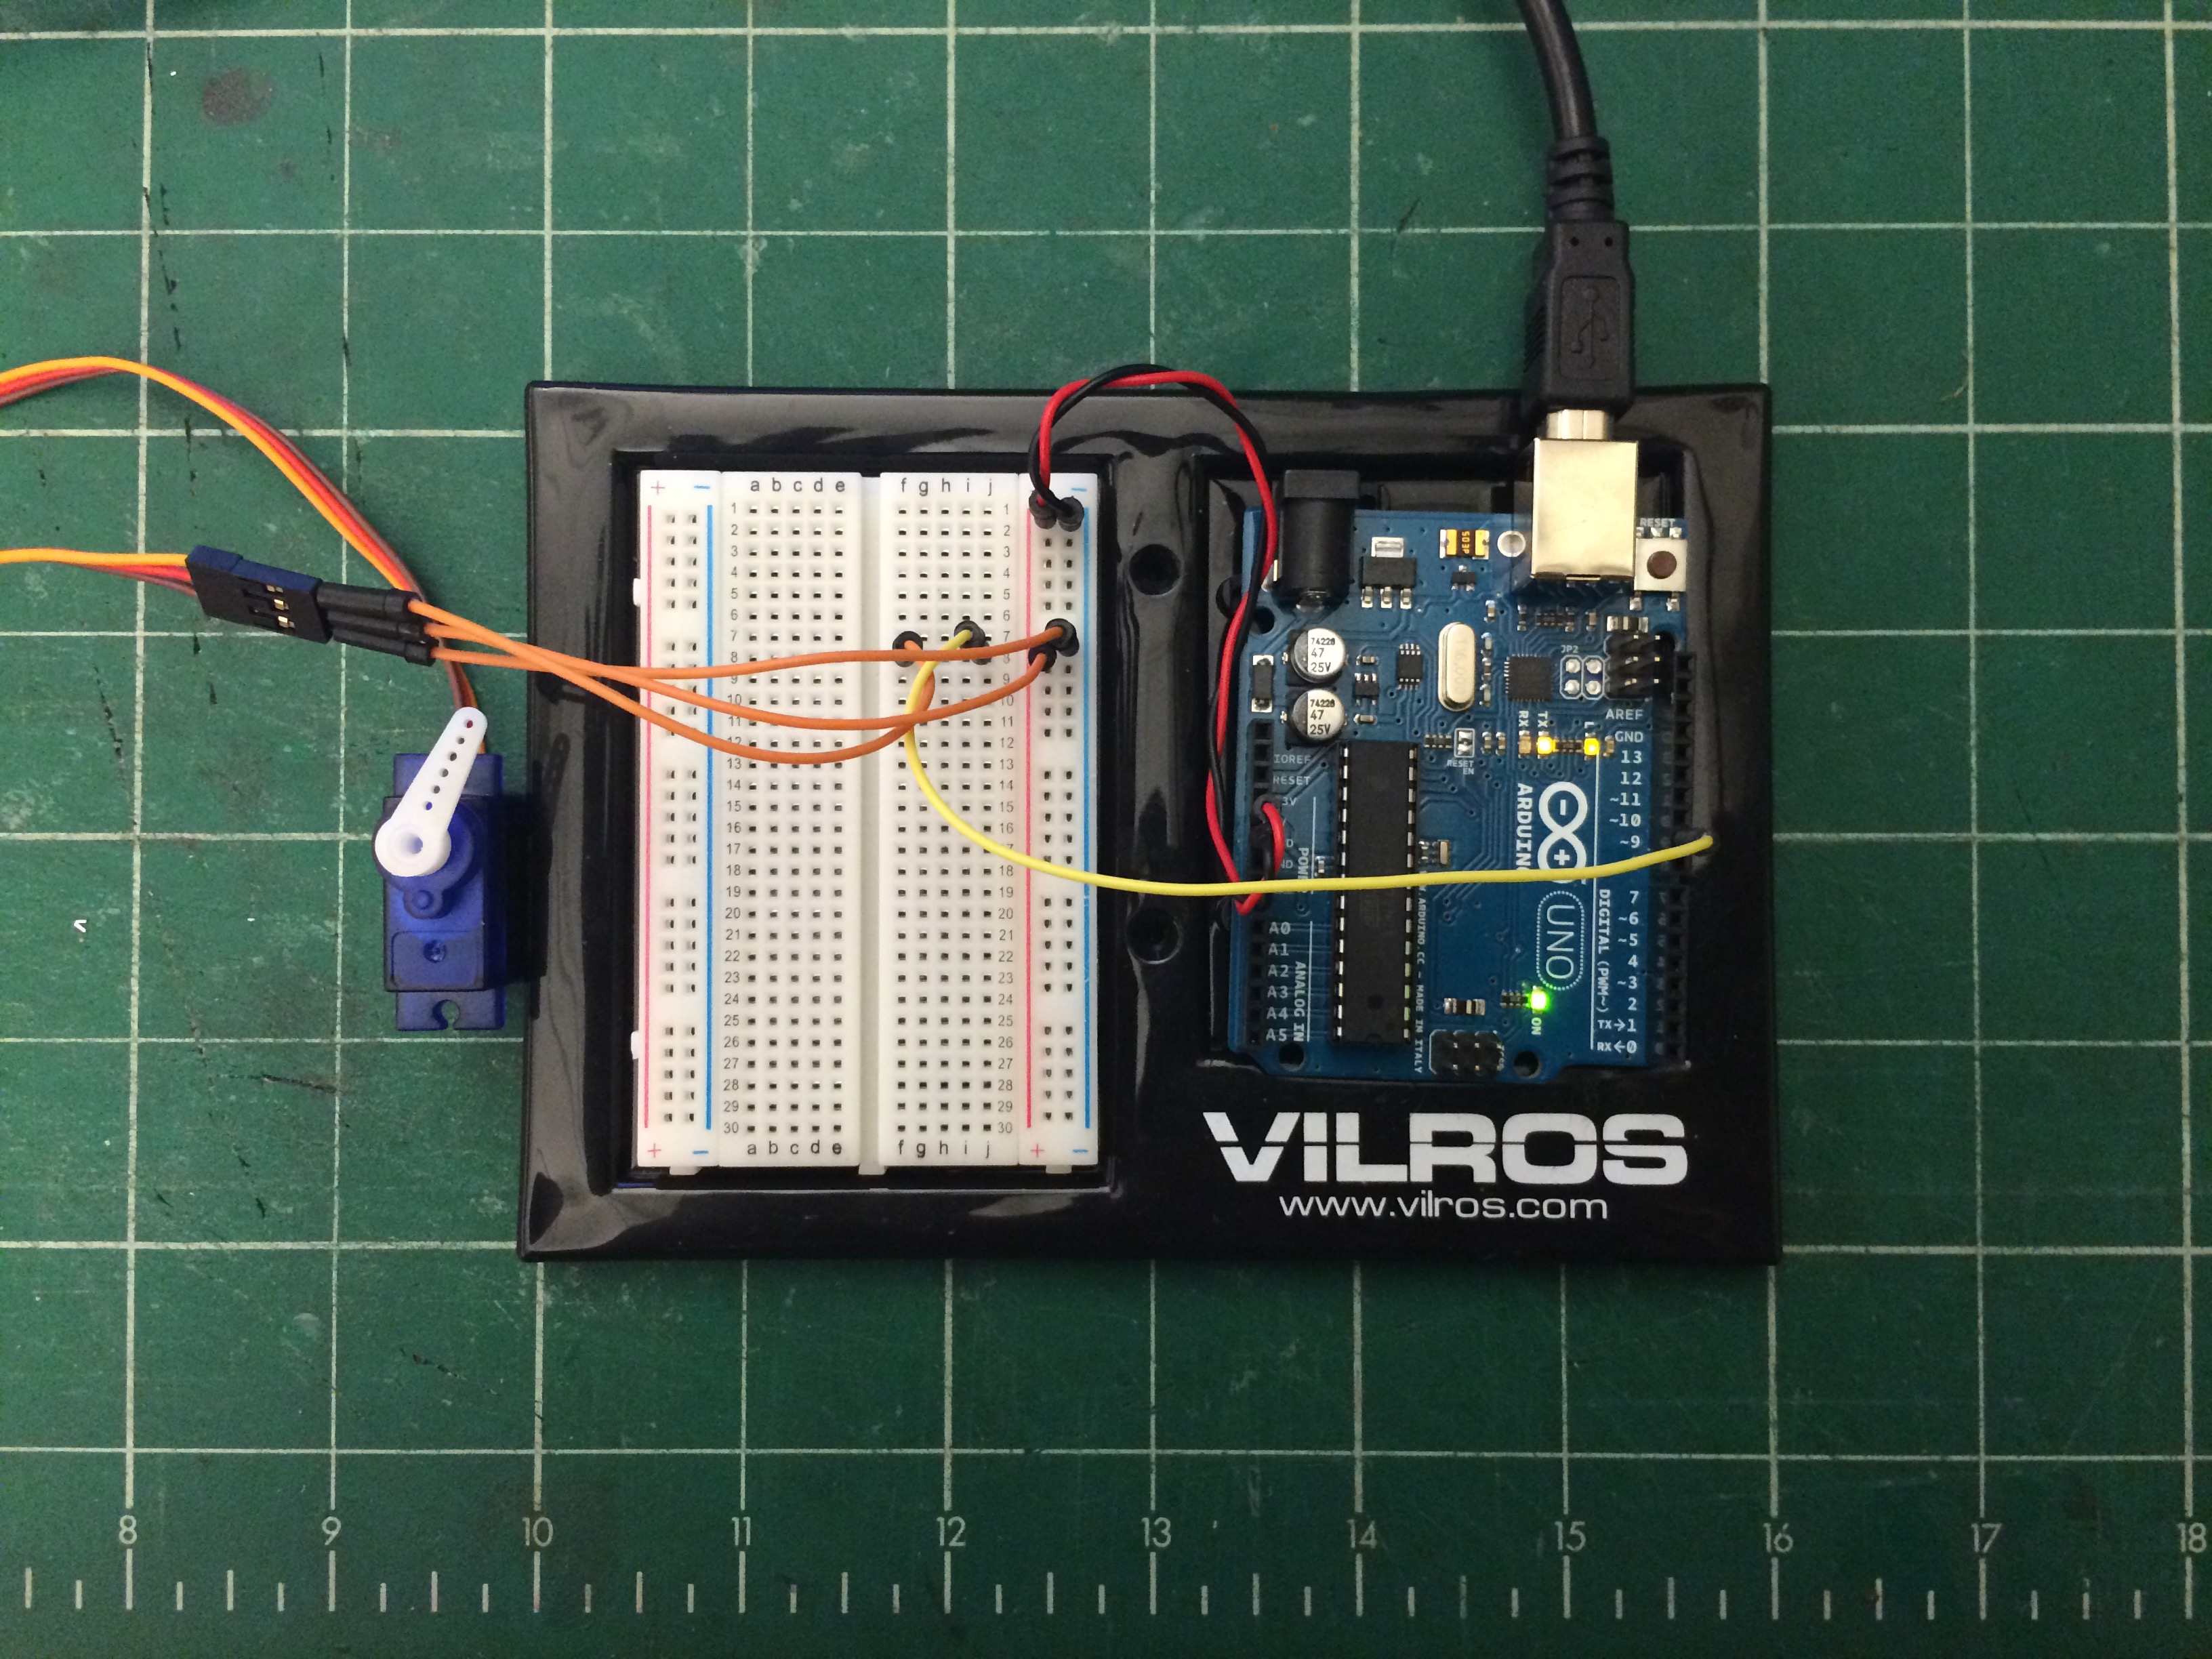
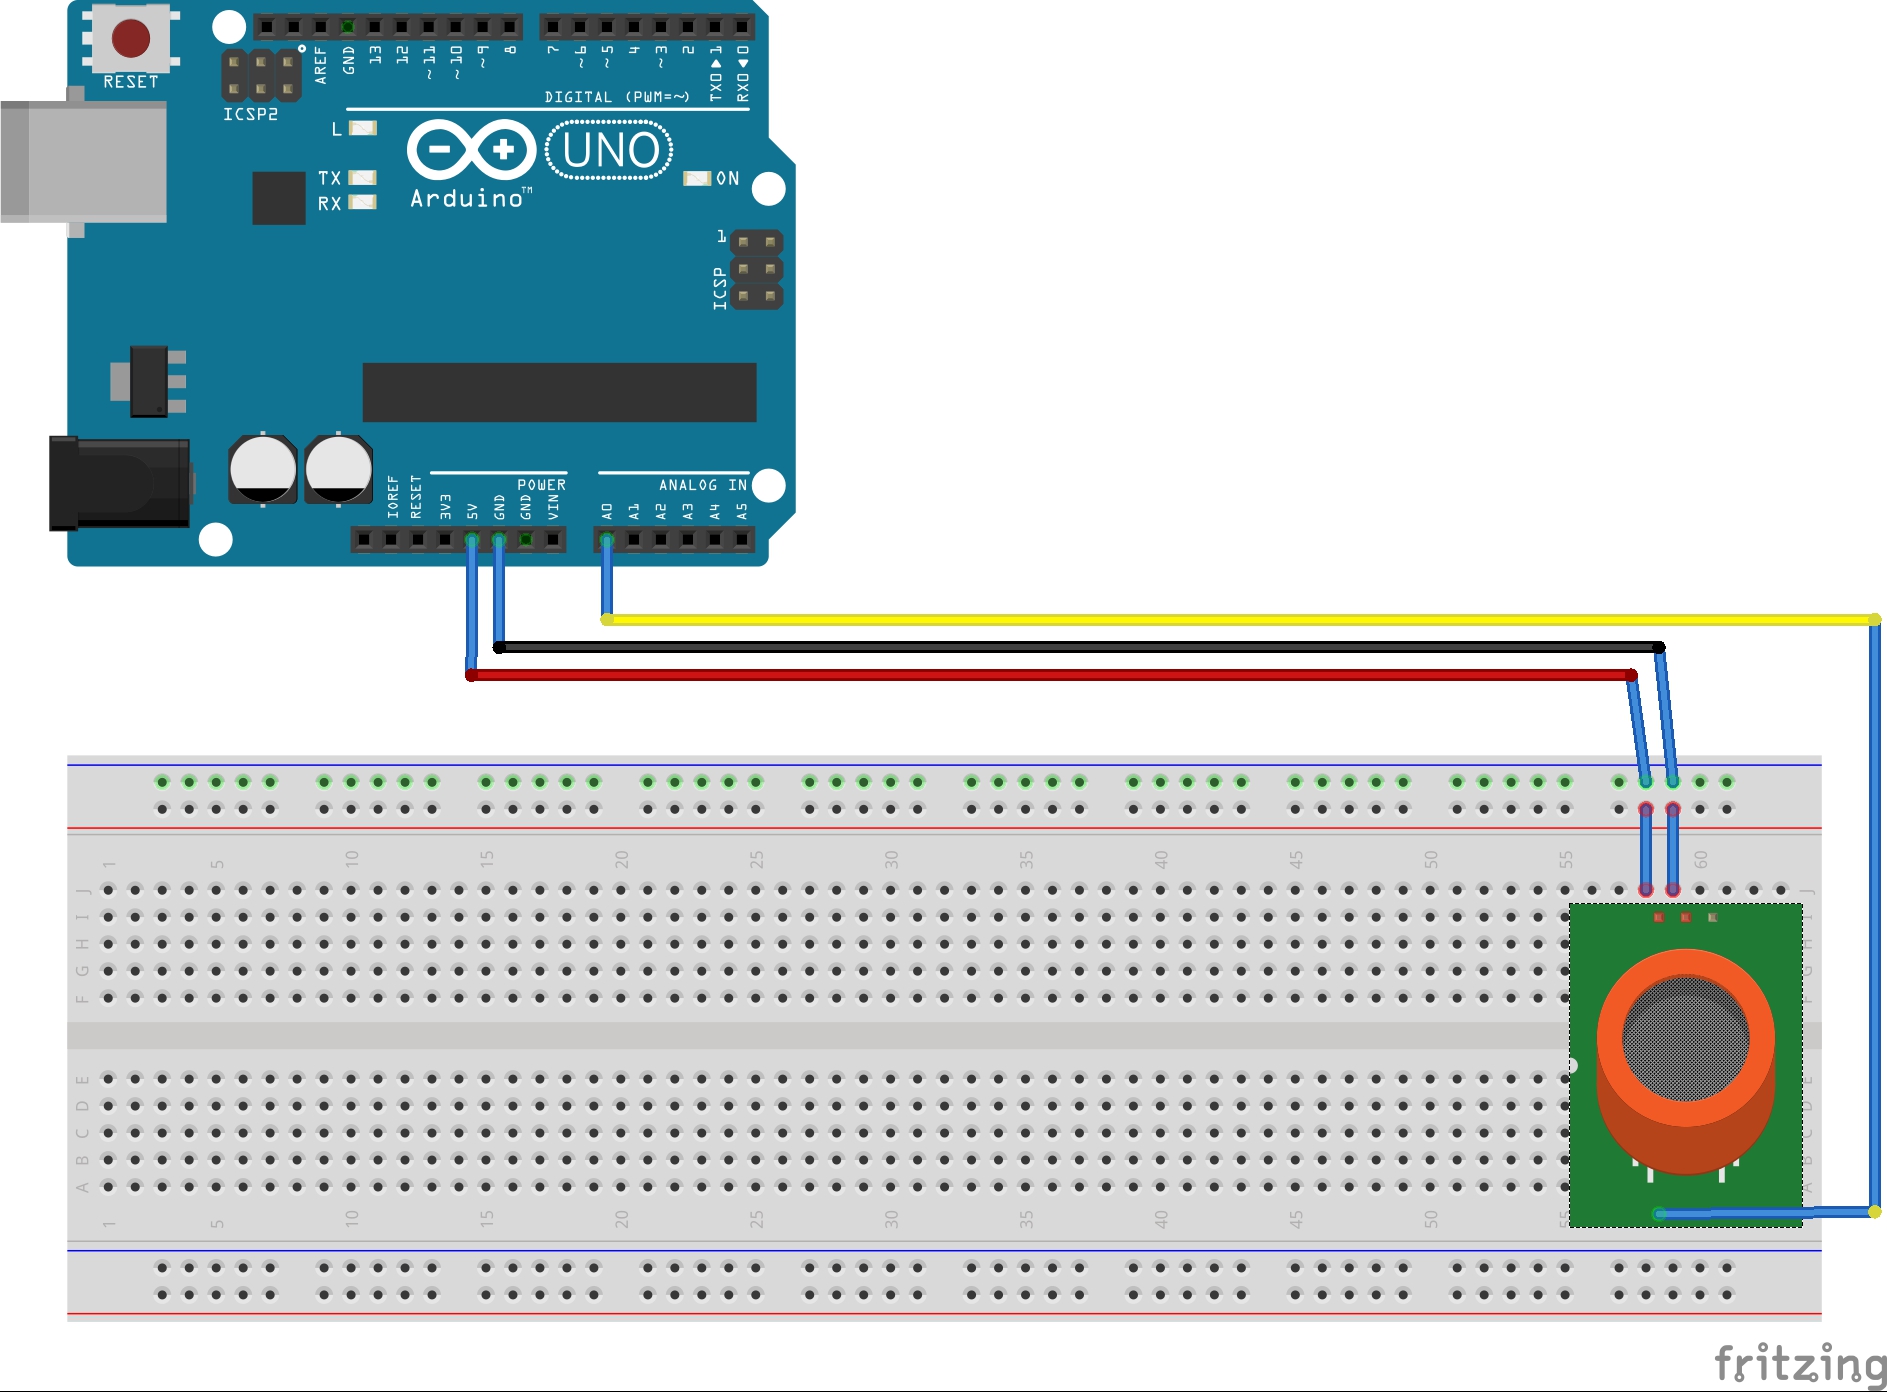
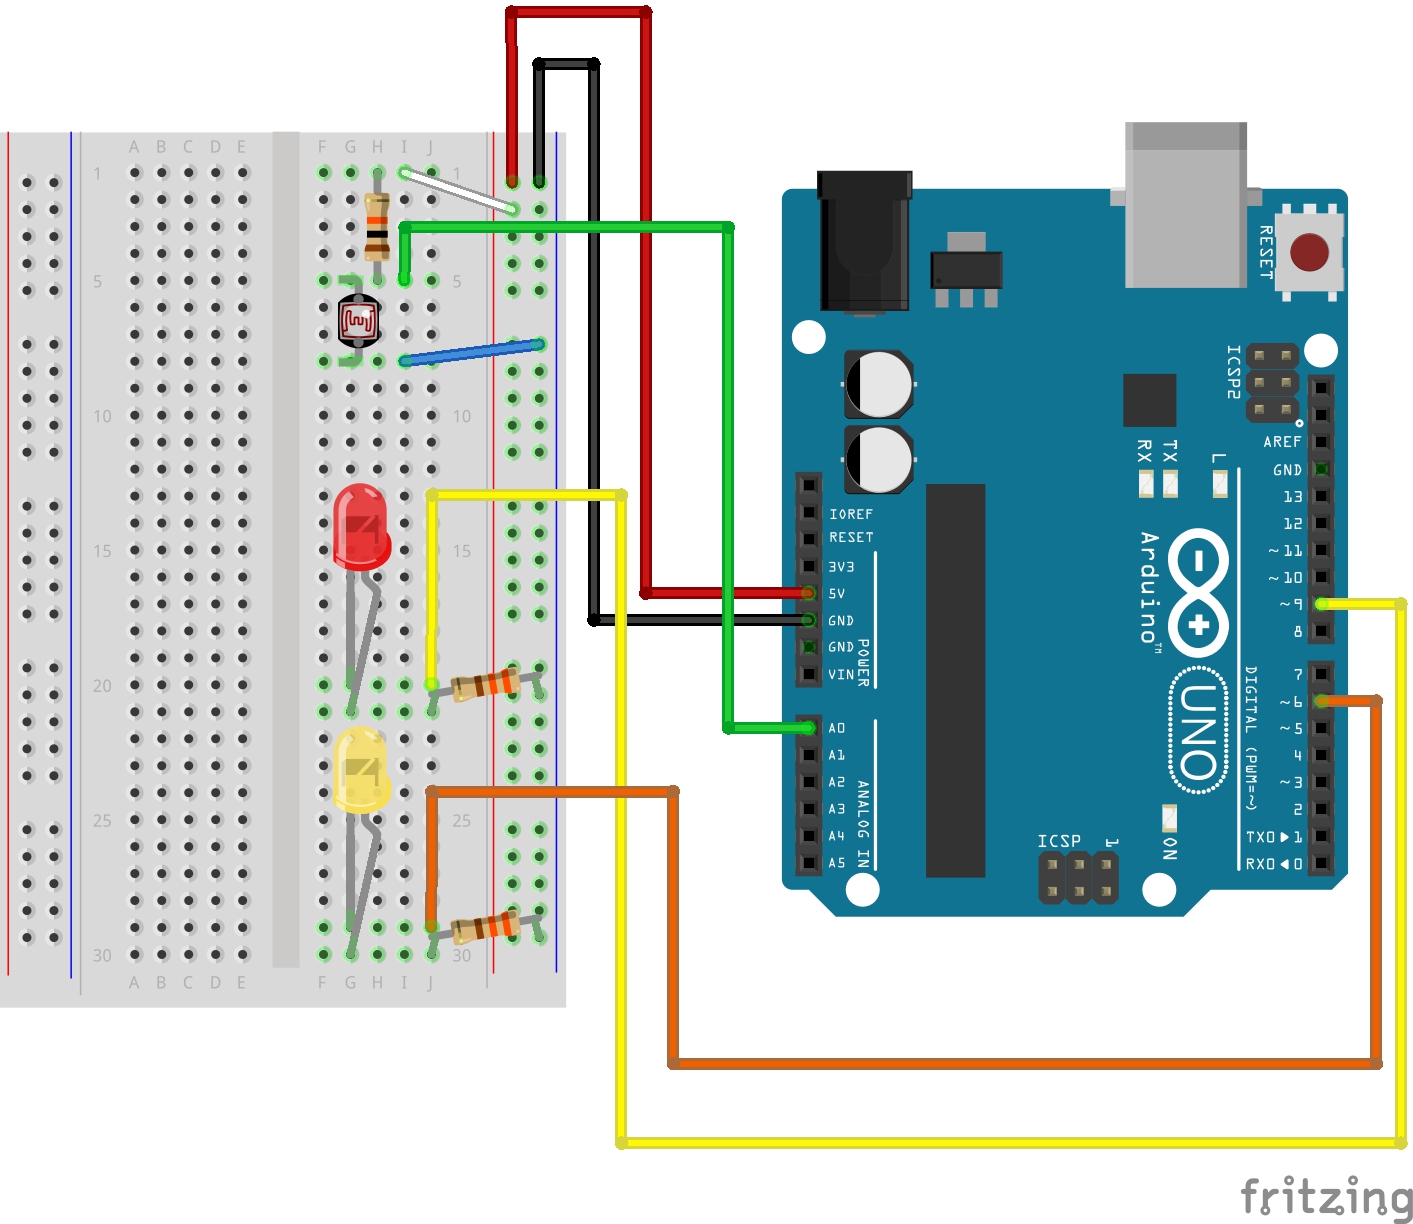
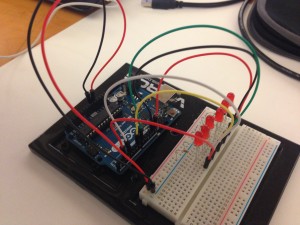
We will first place a wire connecting 5V to a positive strip of the breadboard and a wire connecting ground (GND) to a negative strip of the breadboard.
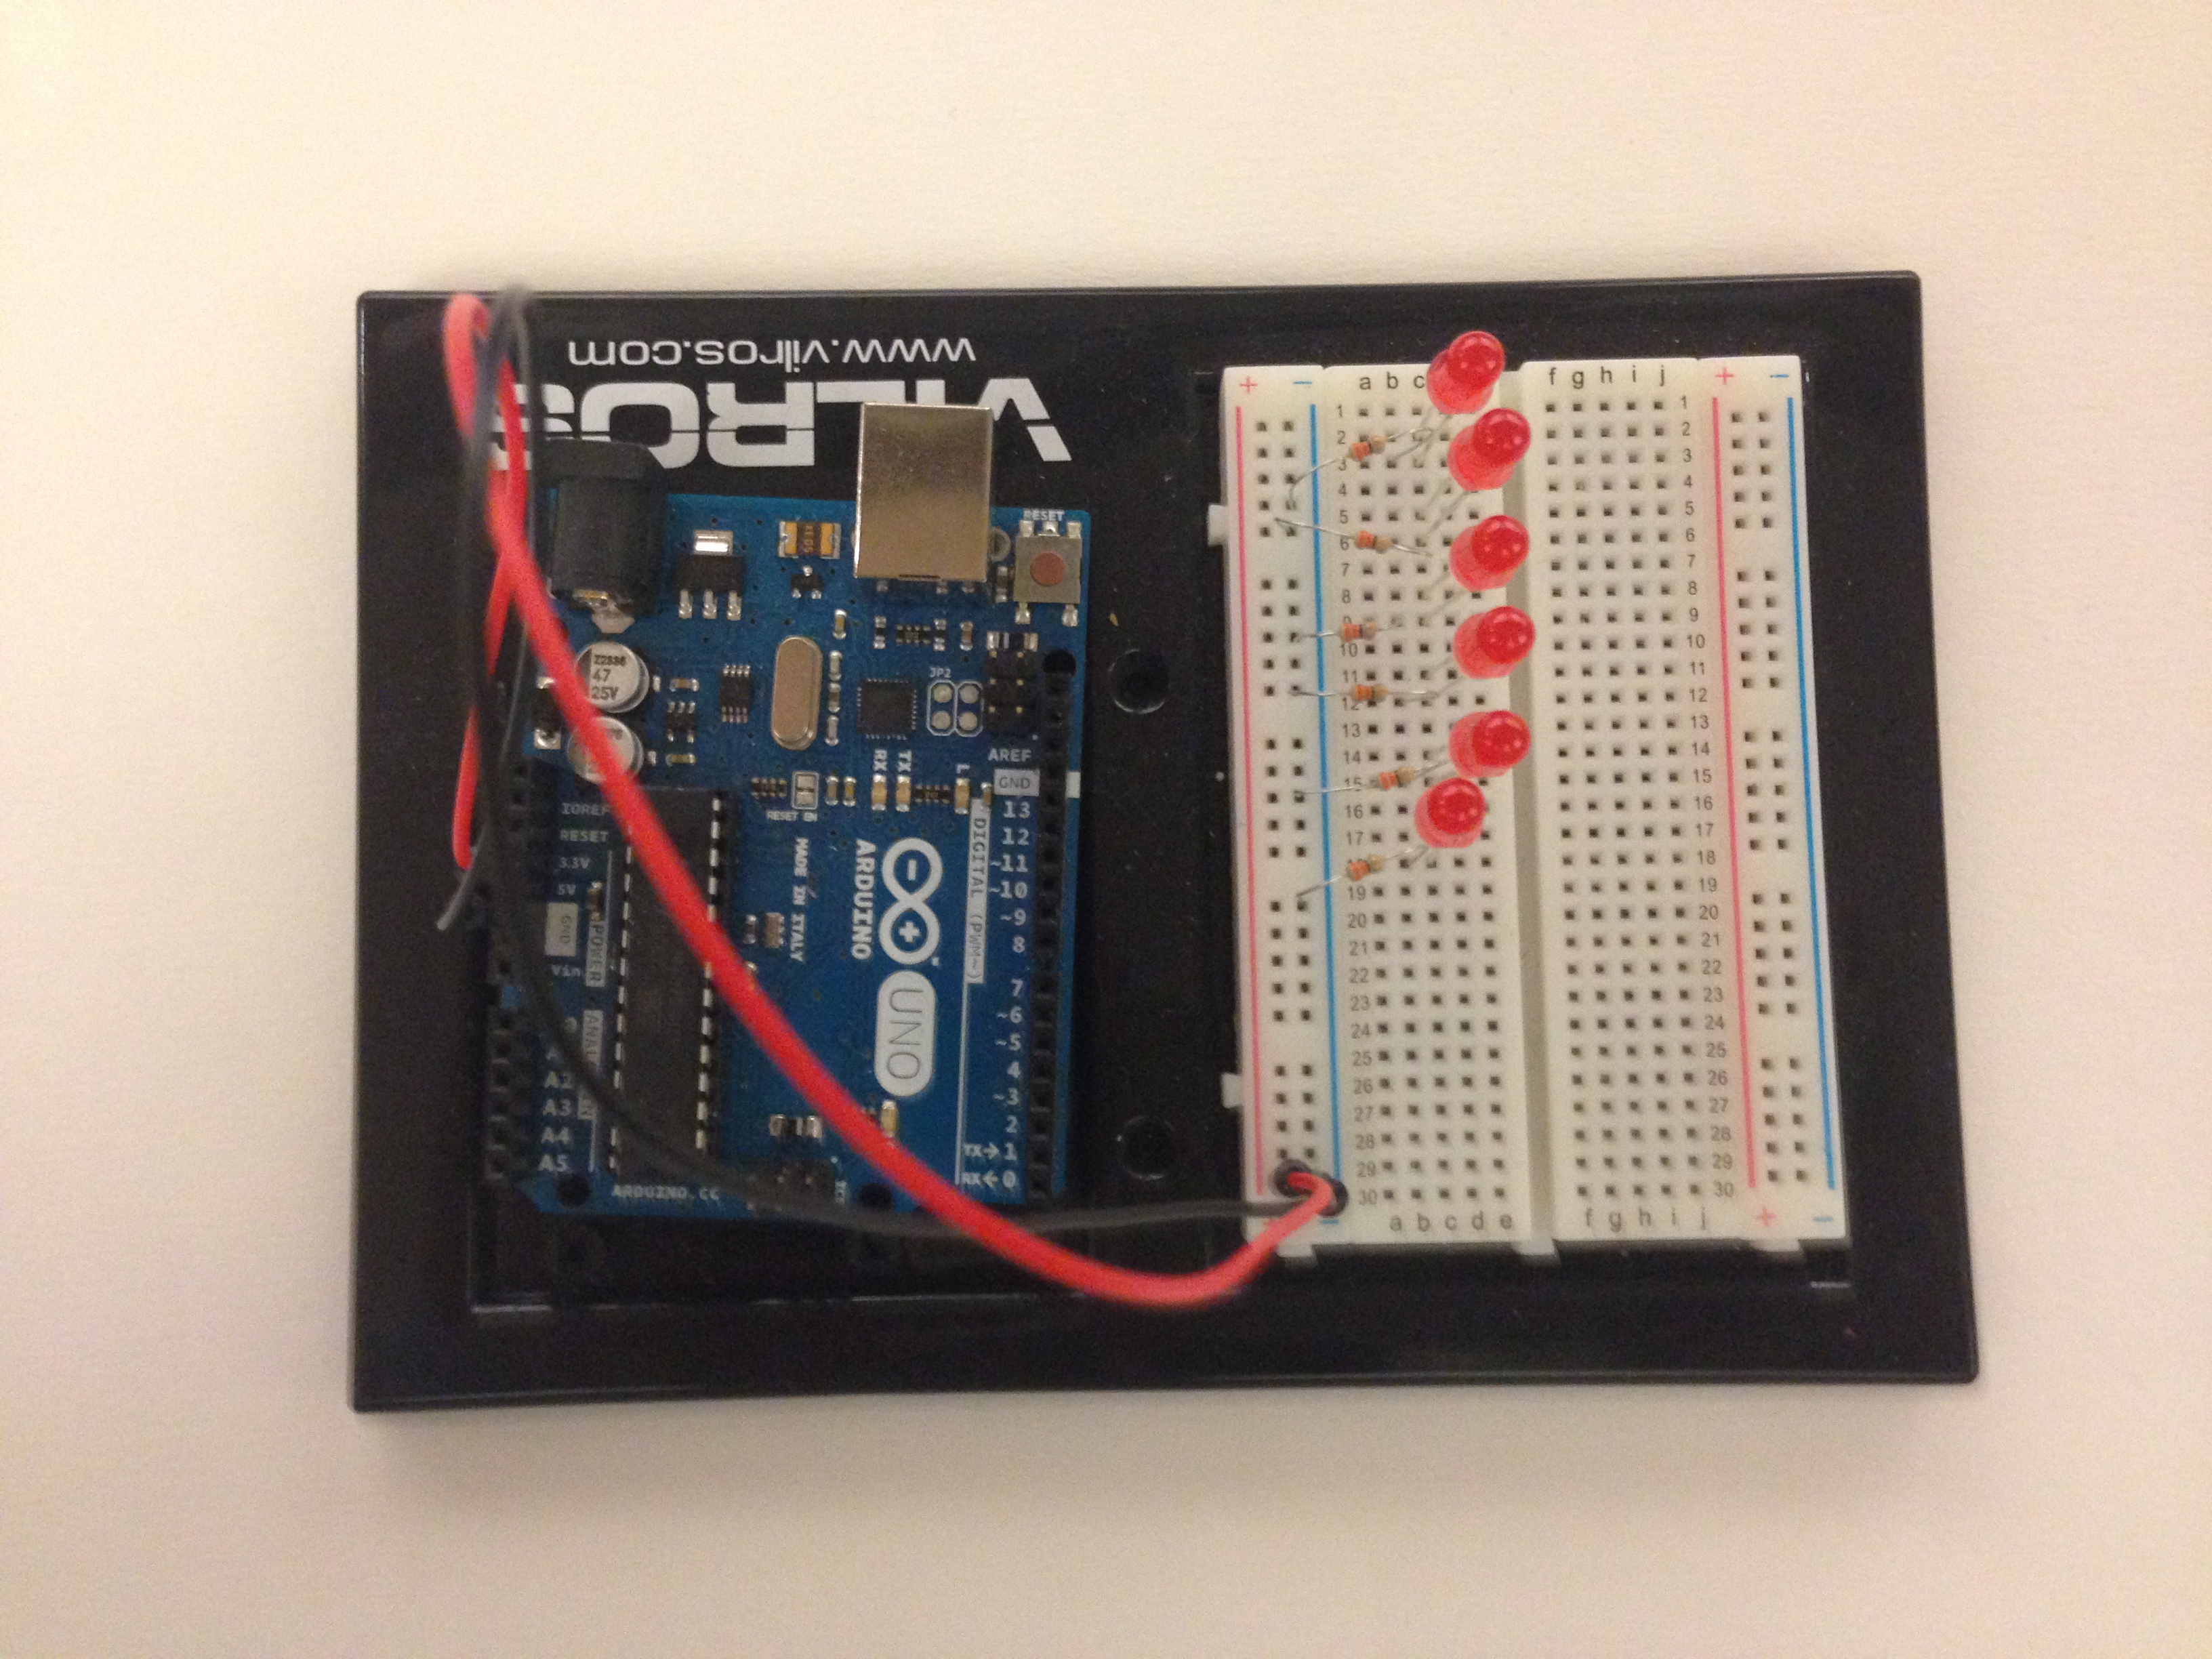
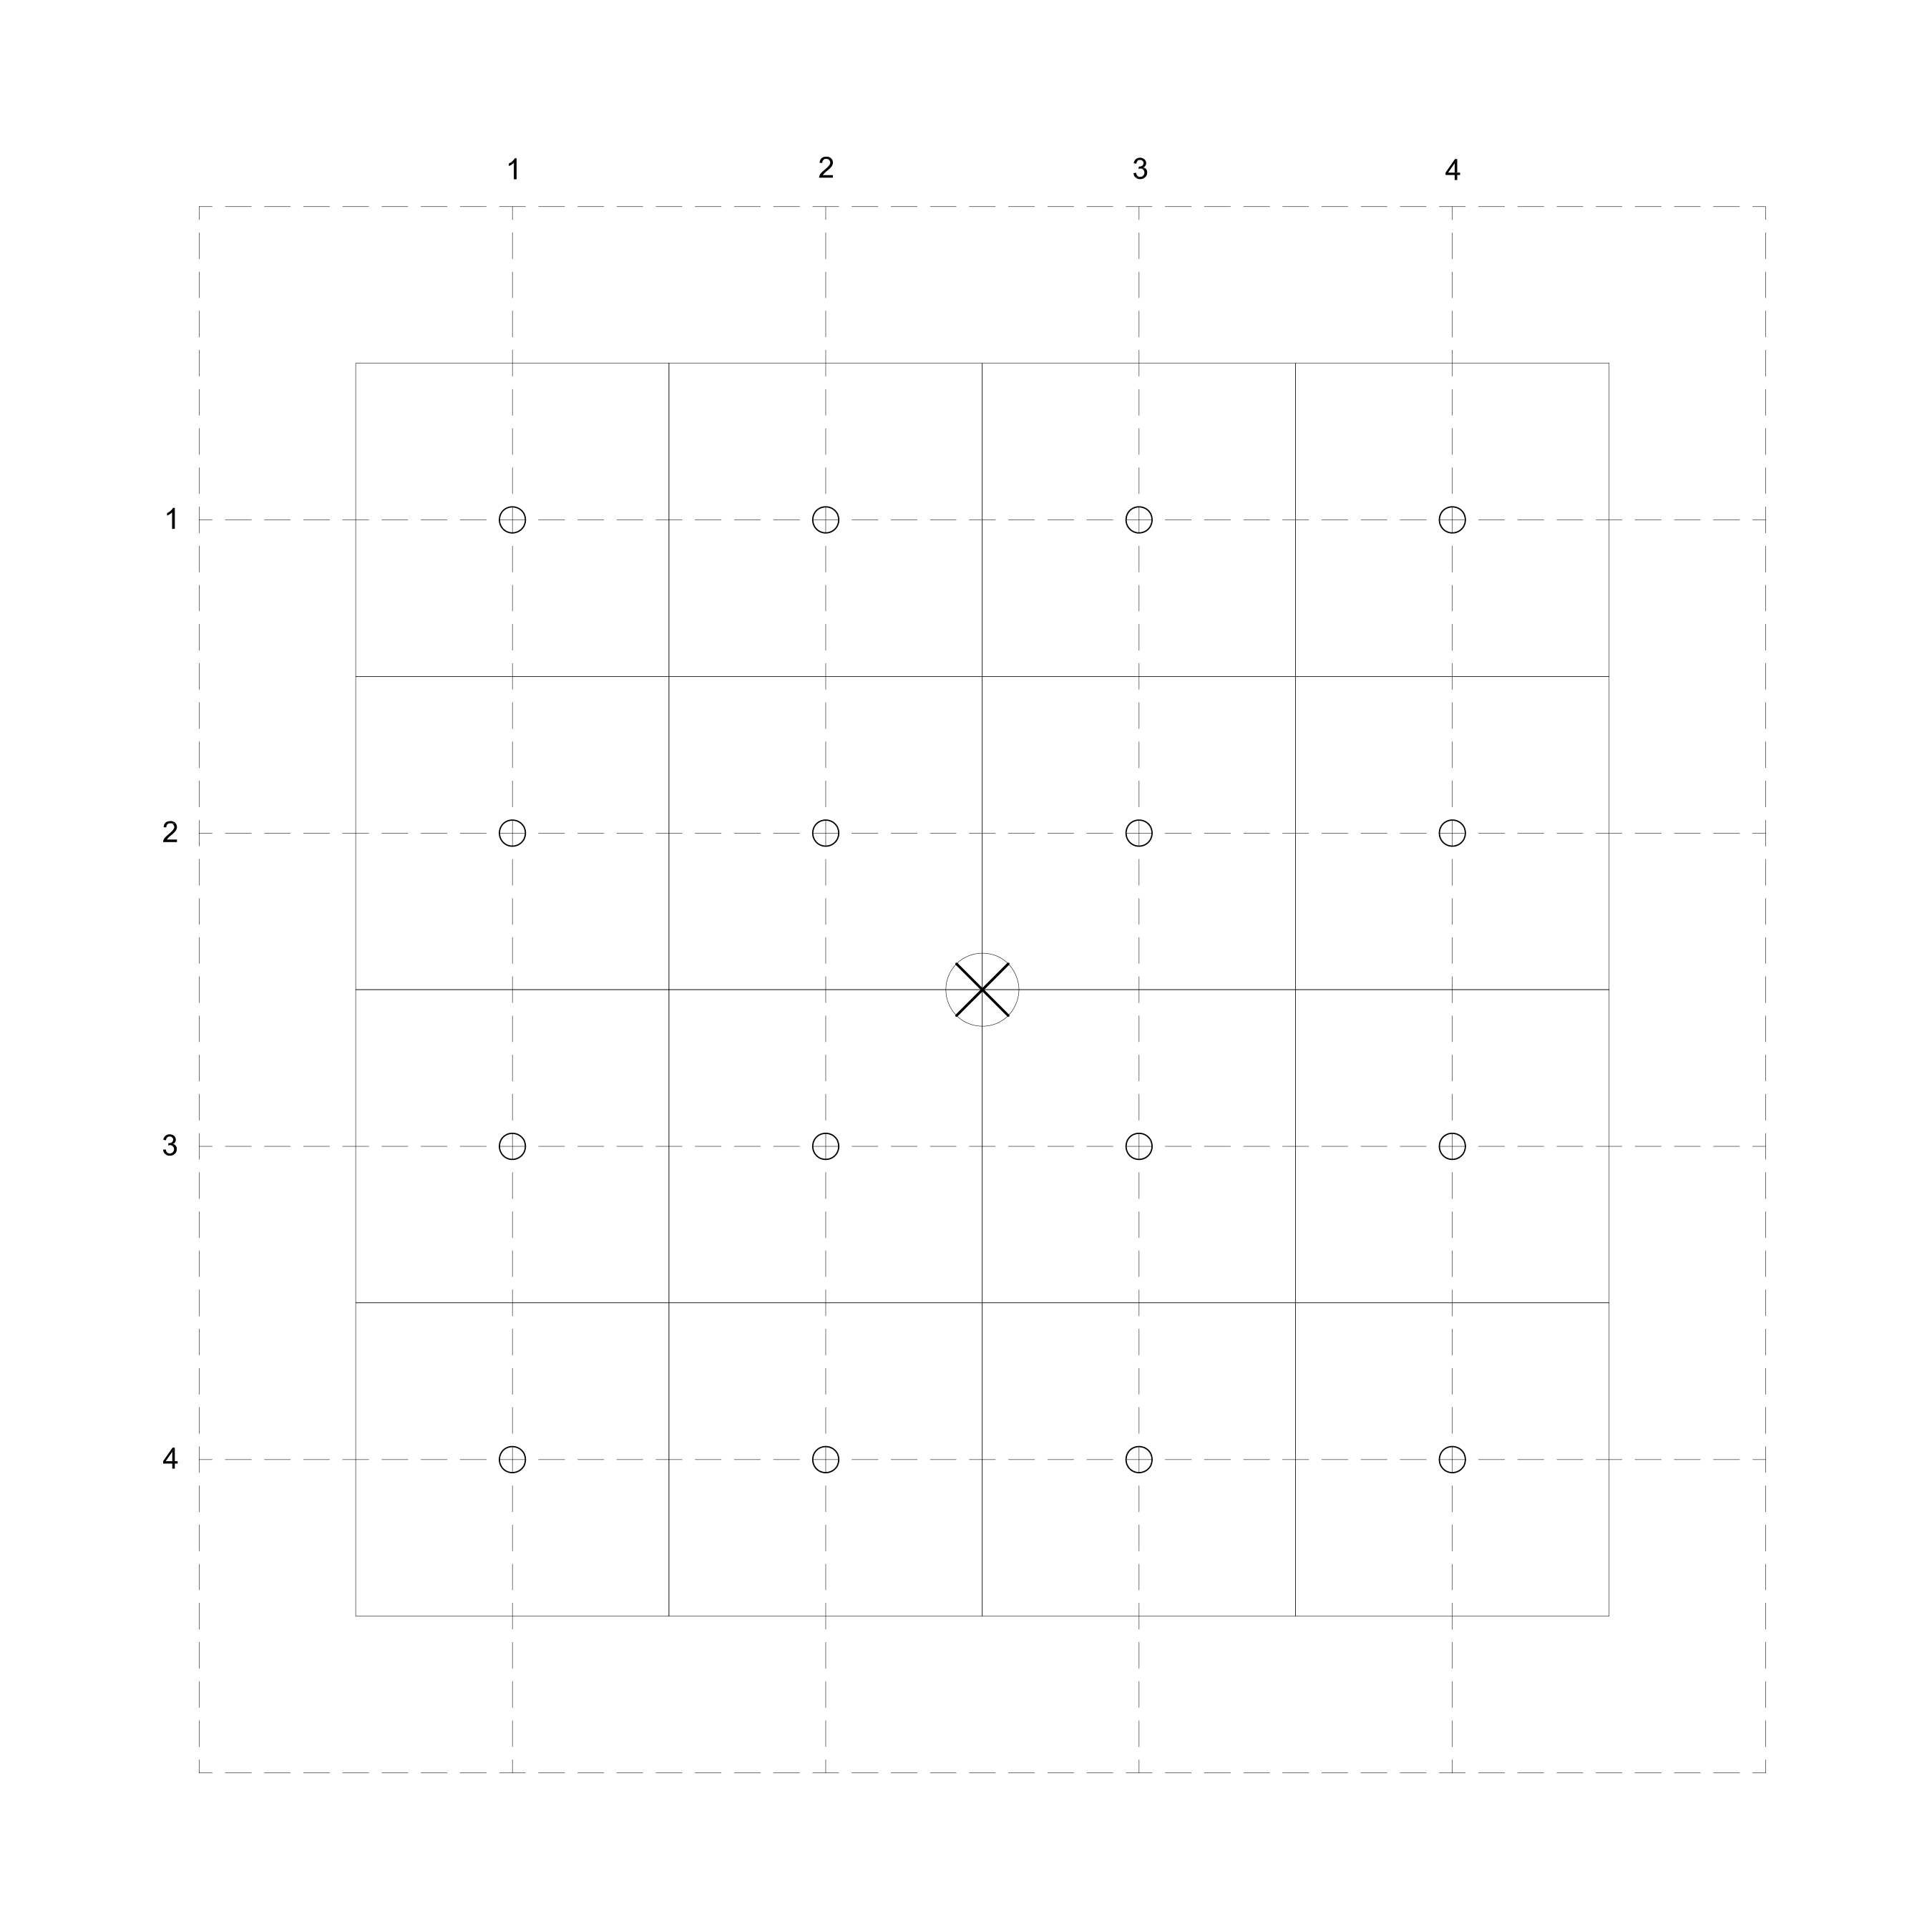
We will now begin placing the 6 LED’s onto the breadboard. Each LED is placed round side up (positive) and flat side down (negative). The LED wires should be aligned on the y-axis. Give adequate space from LED to LED, in this sample they are spaced by one block apart. The next step is to apply the 330 Ohm resistors. Each LED should contain one 330 Ohm resistor connected to its negative or flat side of the LED and grounded onto the negative strip of the breadboard.

The next step is to apply a pin number to each of the LED’s. In this sample we have avoided the use of TX, RX and PWM pins (0, 1, 3, 5, 6, 9, 10, 11) due to malfunction in the reception of instruction for each LED. We have applied a pin to the positive side of each LED. We utilized pin 13, 12, 8, 7, 4, and 2 and applied it in such order from top to bottom.
Step 2 Setting Photo Resistors
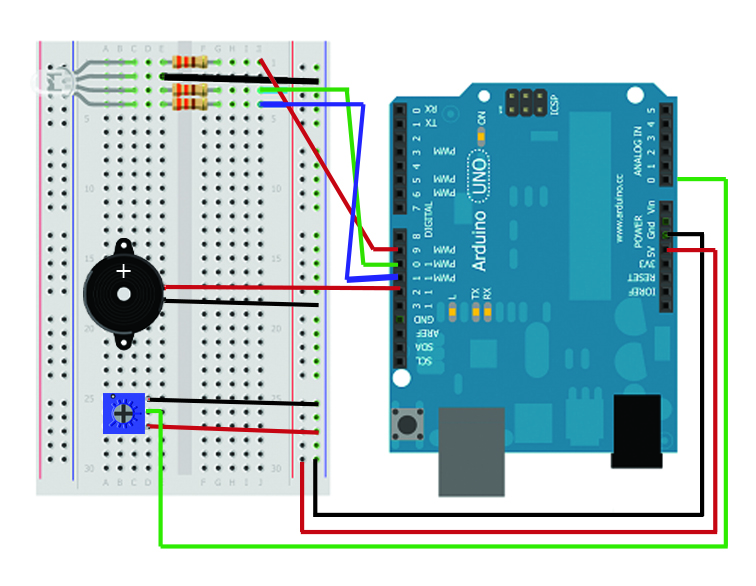
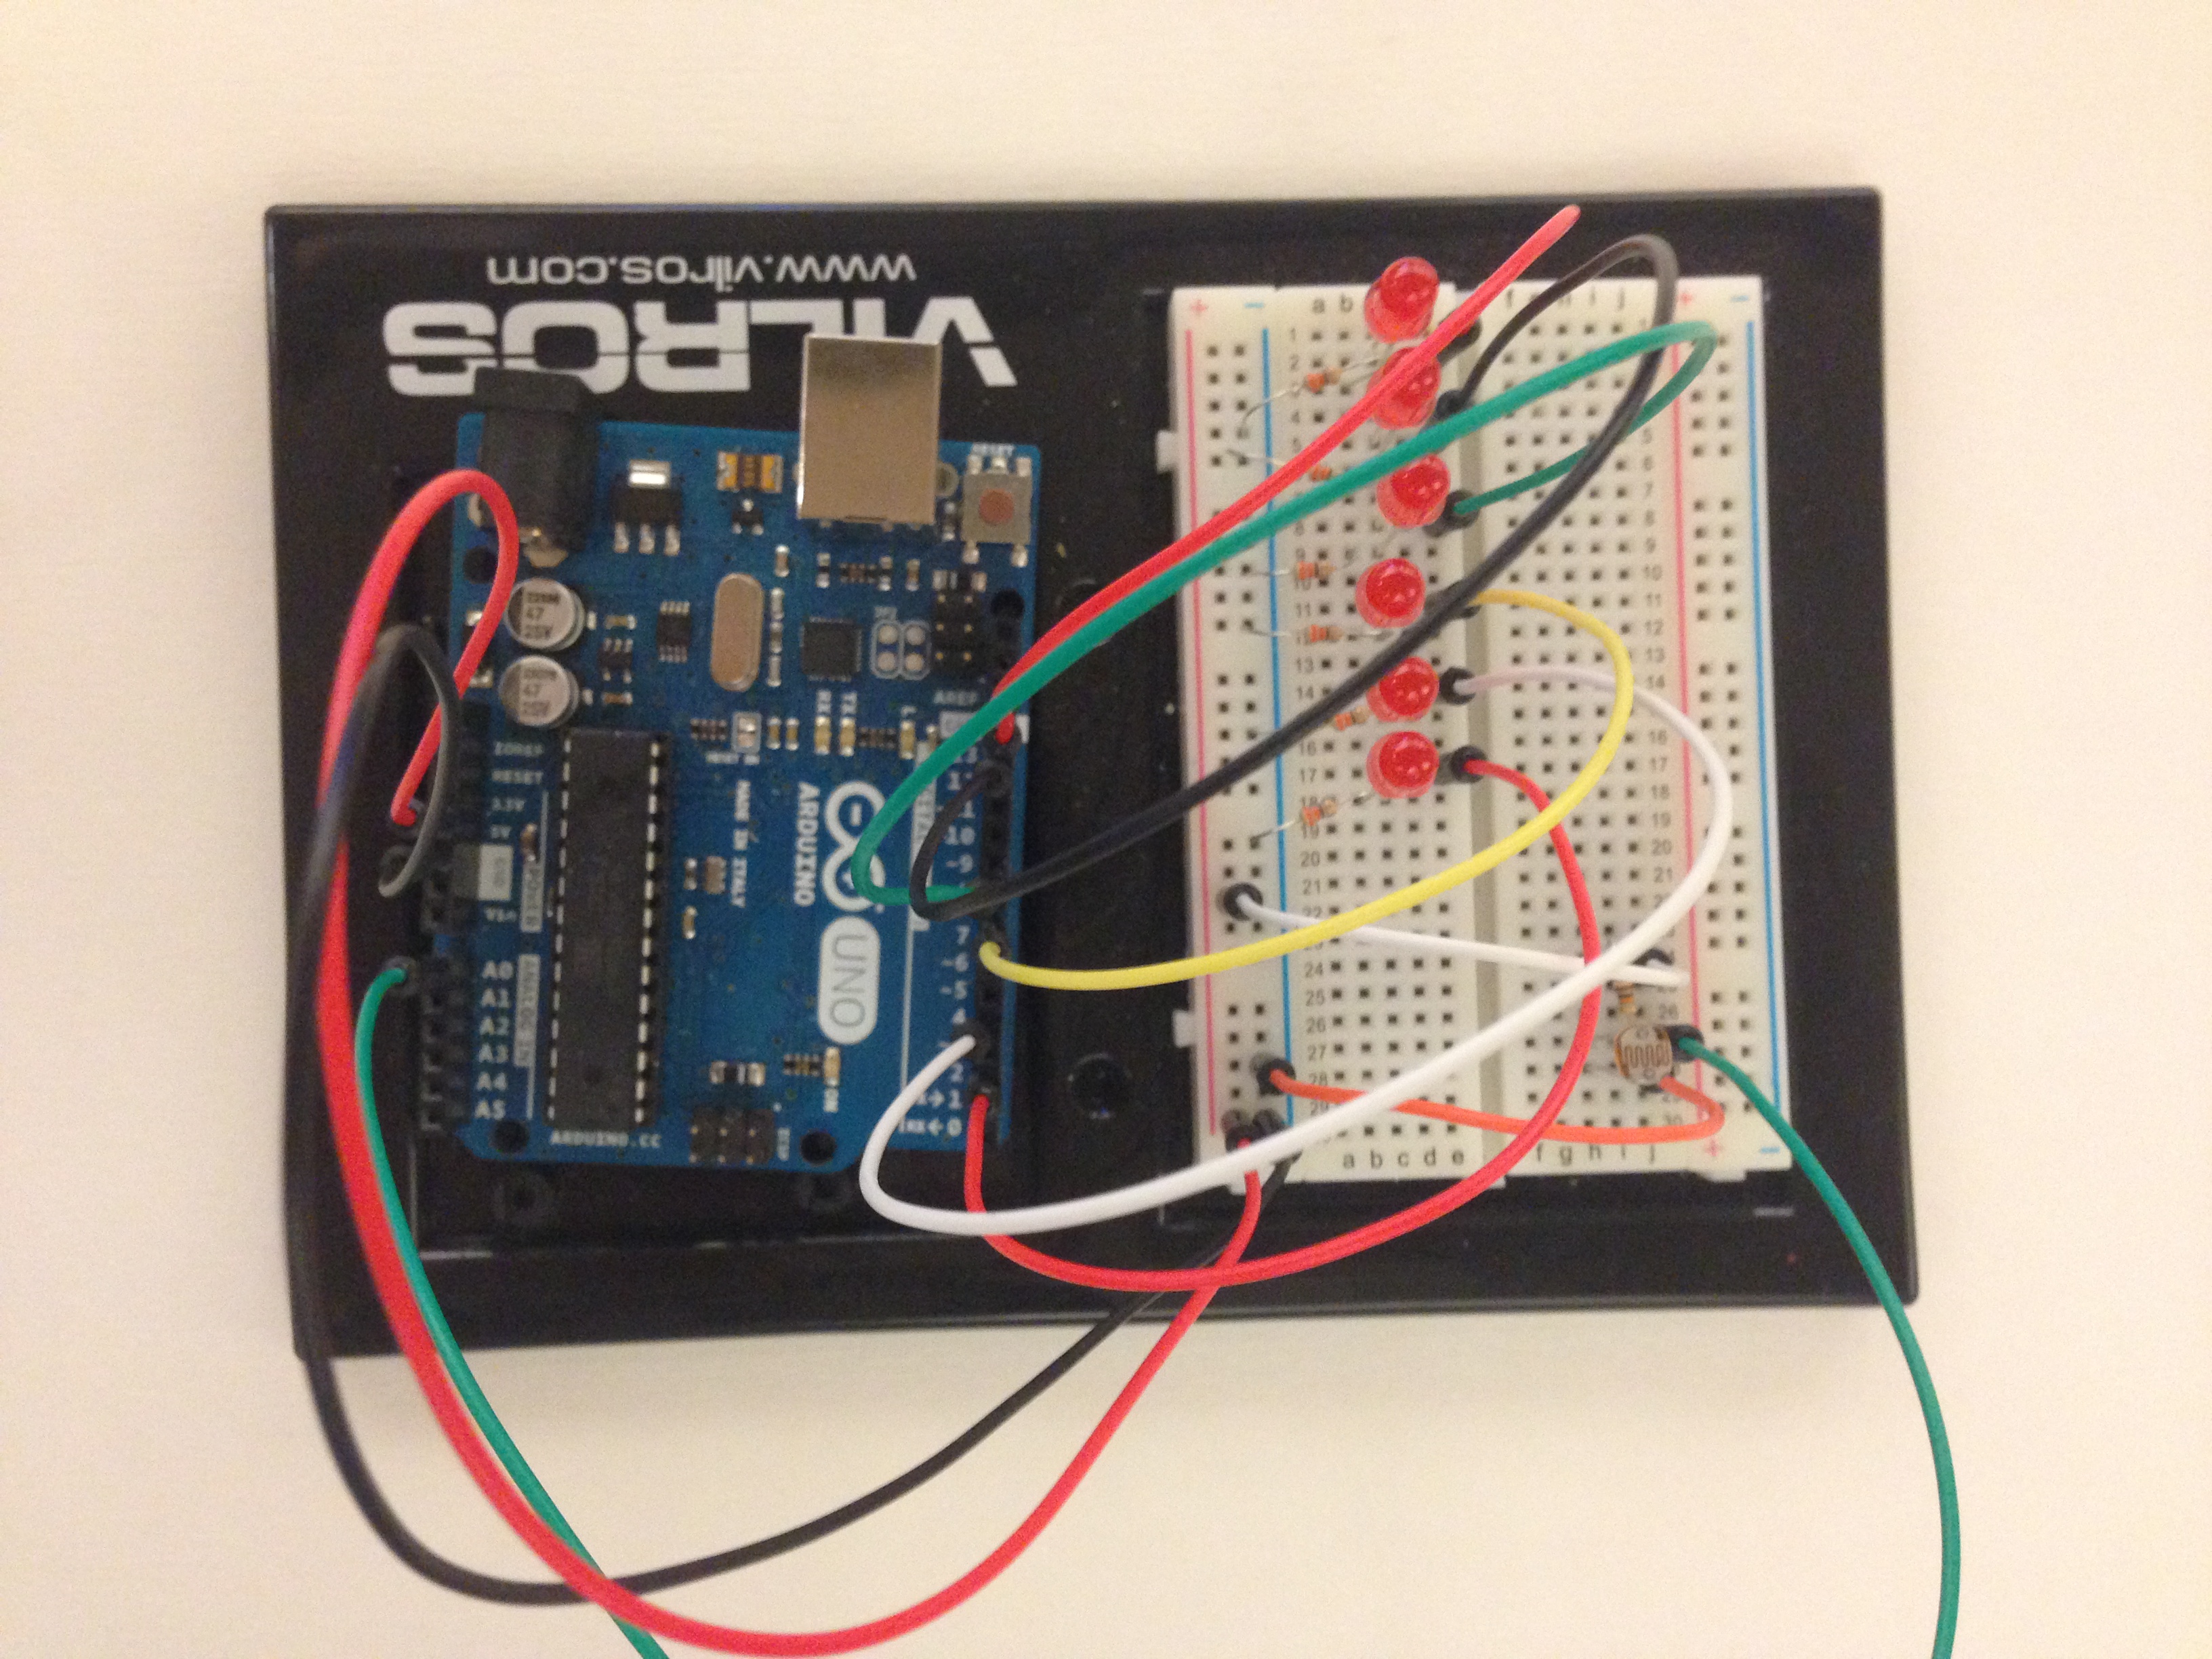
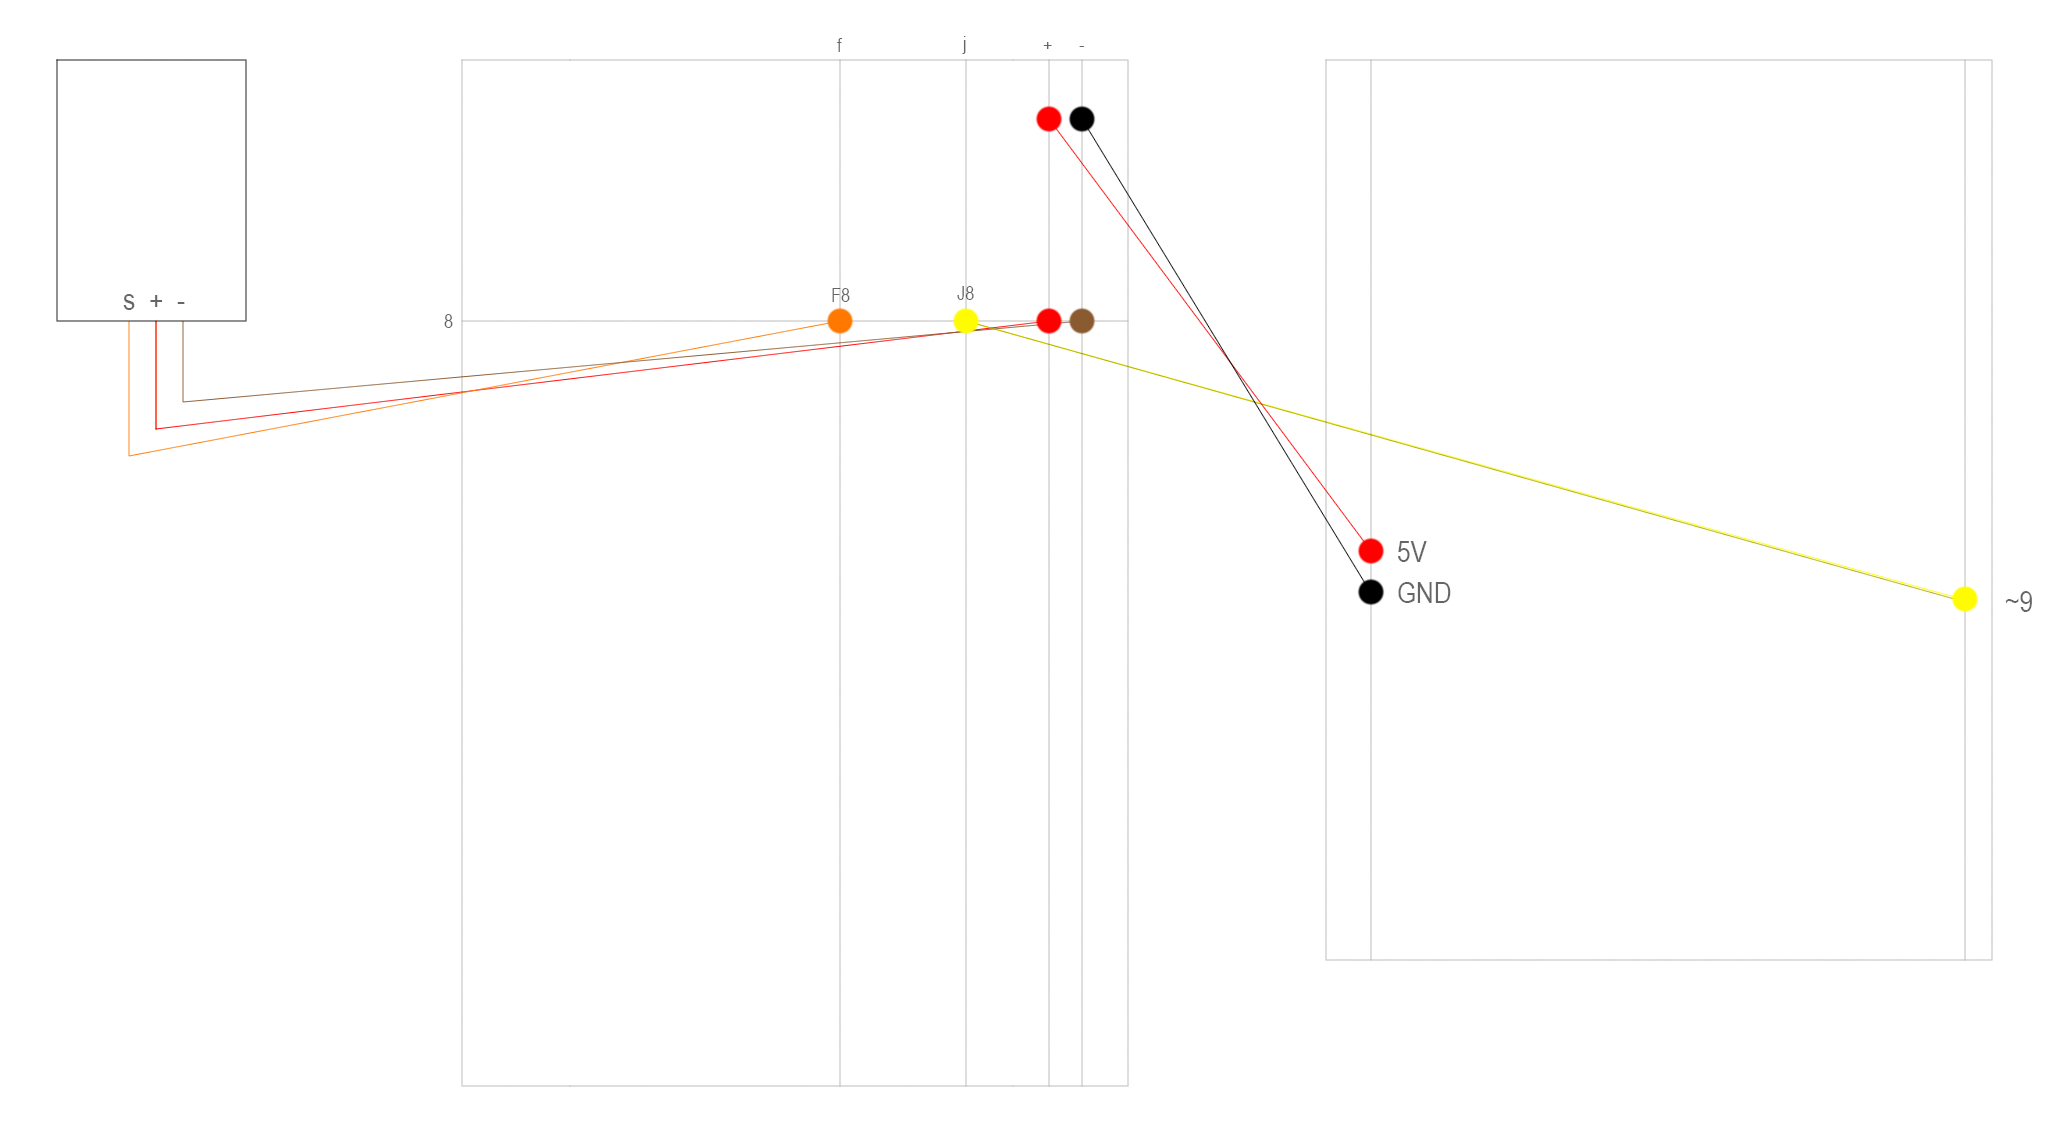
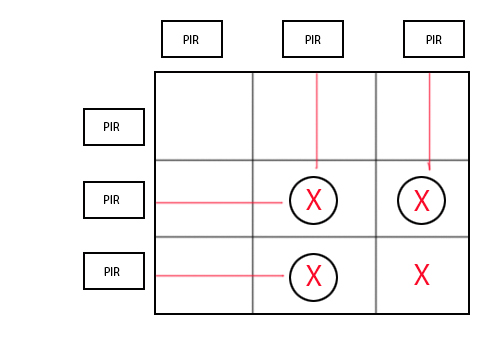
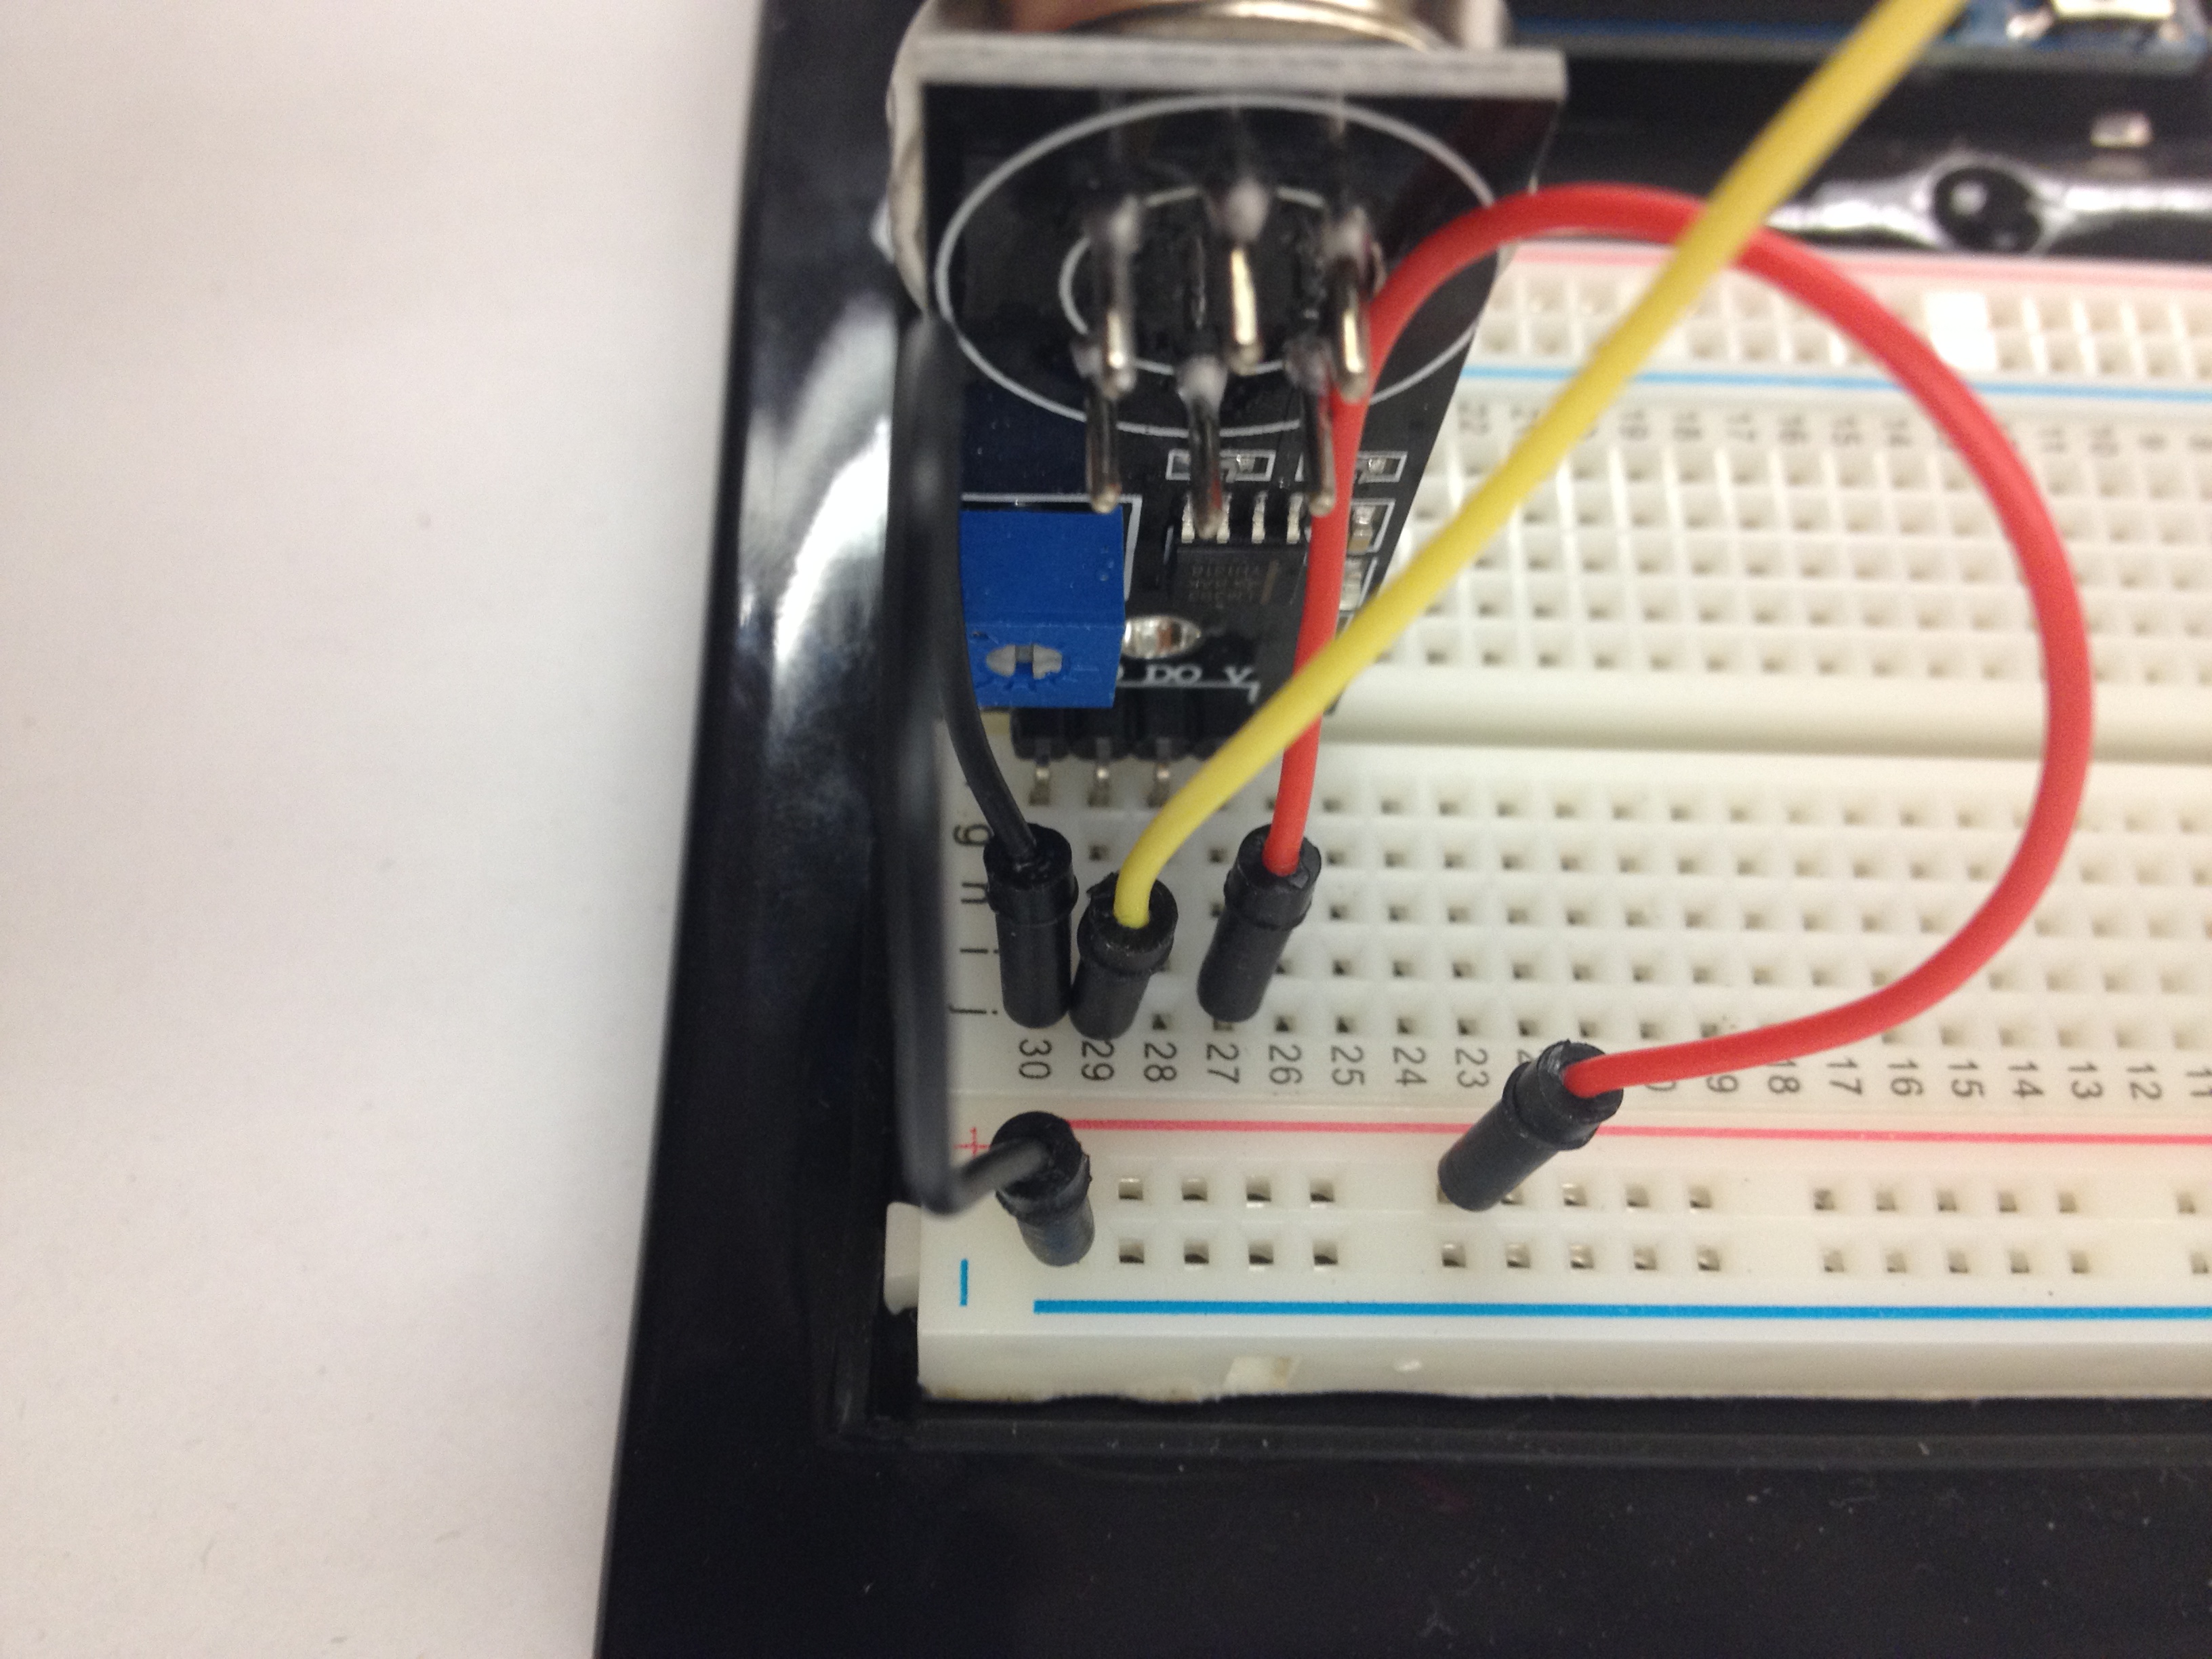
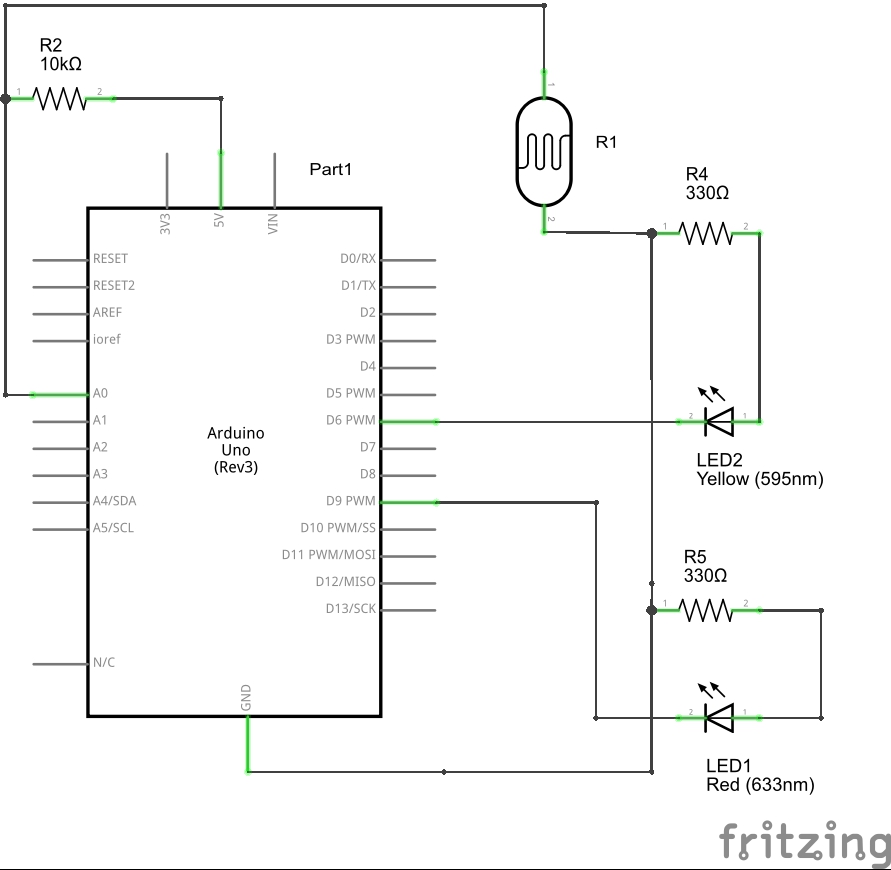
For the second step we must apply the photo resistors. We apply one of them aligned to the y-axis. We then apply a 10k resistor also aligned to the y-axis. The bottom of the 10k resistor should be on the same line as the top of the photo resistor. Also, the top of the 10k resistor must be connected to the 5V using a wire connected to the positive strip of the breadboard. (Refer to drawing). The bottom of the photo resistor must also be grounded. Last but not least, the photo resistor must be given a pin for it to register data. For this we will use an analog pin A0. Repeat the same process using different squares on the breadboard for the second photo resistor. The only difference for the second photo resistor will be the assigned analog pin, analog pin A1.

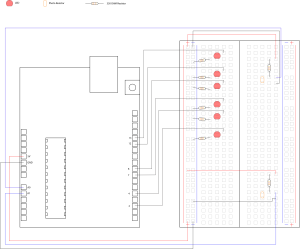
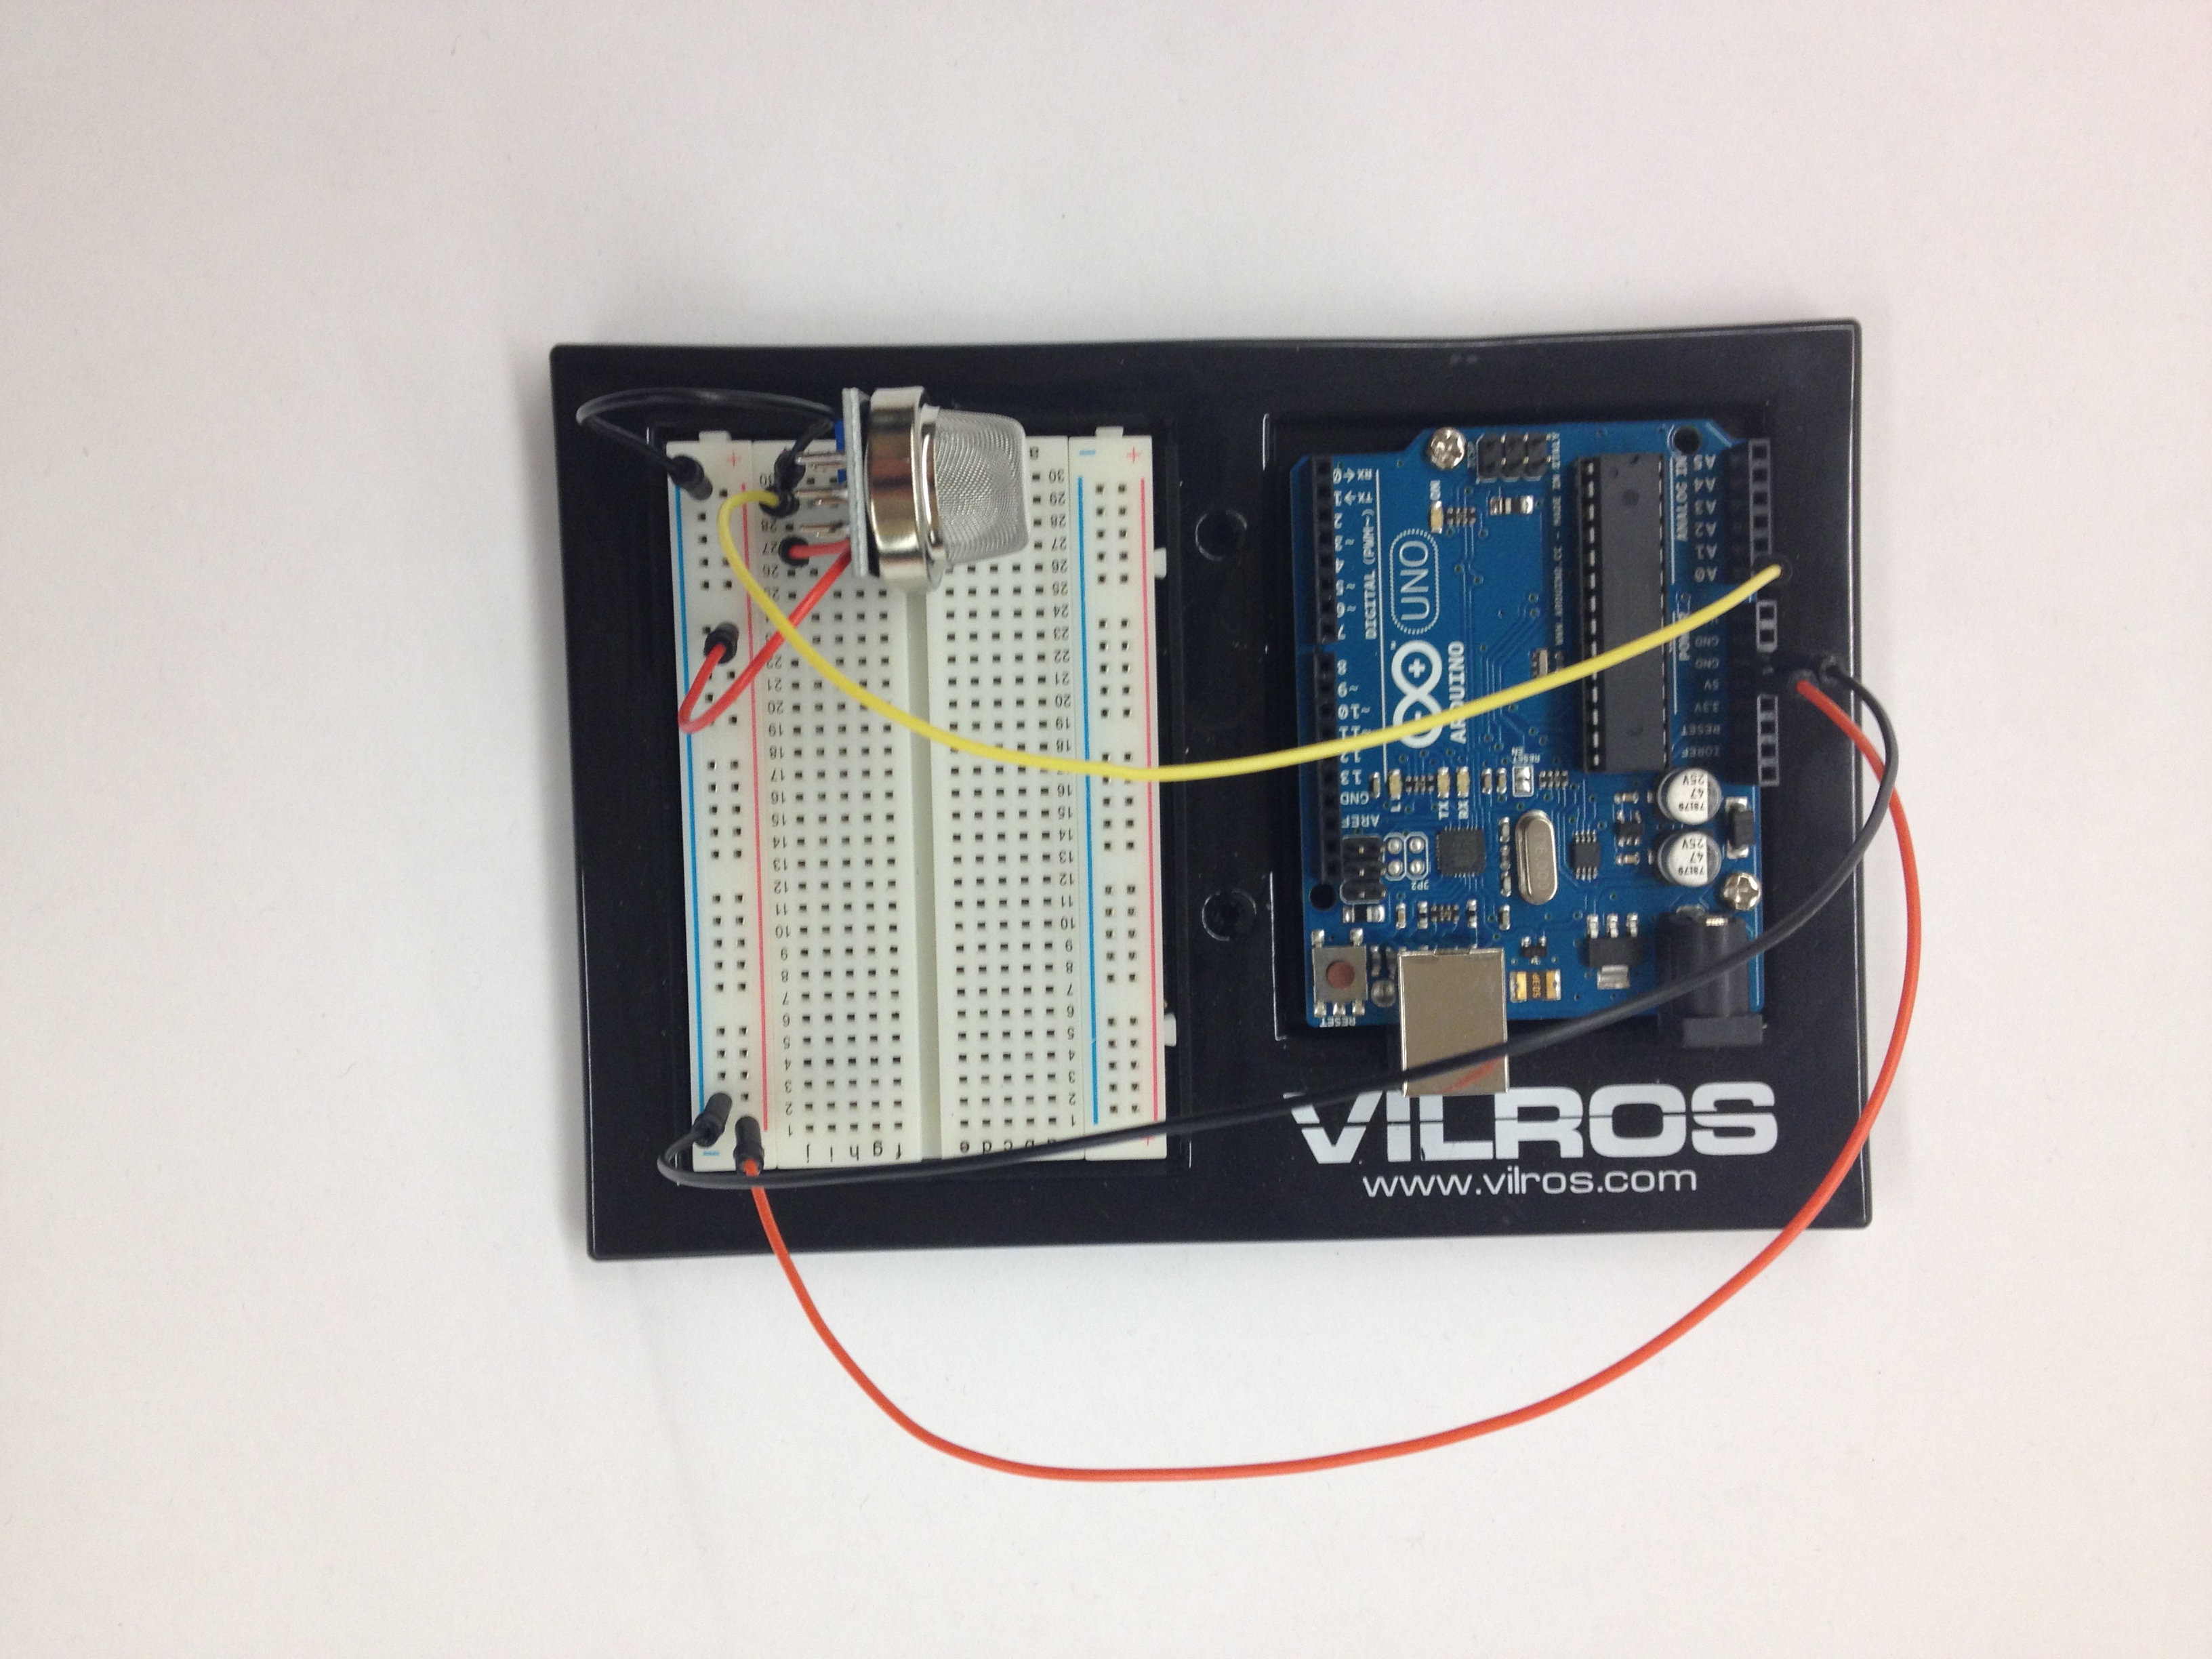
ArduinoCircuitSample
Step 3 Coding
We start the code by stating all the pins in use. First we indicate both analog pins A0 and A1. Second we create two arrays each storing a separate group of pins. We grouped pins 13, 12 and 8 into one and 7, 4, and 2 on the pin A1. We also require a pincount for each of the arrays. Each has a specific name and the number of pins per group, in this case 3 per array.
|
|
int sensorPin = 0; //Connect photo resistor to analog pin A0. int sensorPin1 = 1; //Connect a second photoresistor to analog pin A1. int ledPins[] = {8,12,13}; //Create an array to list a number of LEDs to control.(Note: in this //array we have avoided using PWM pins, TX pin and RX pin. int ledPins1[] = {2,4,7}; //Create a second array to list a seperate number of LEDS to control. int pincount = 3; //Define the number of pins utilized in the first array. int pincount1 = 3; //Define the number of pins utilized in the second array. int lightLevel, high = 0, low = 1023; //Define the global vairables for thhe light level. |
Void Setup
The next step is setting the void set up. Here we will setup an index to organize the pin order. We will also use a “for” statement to repeat a block statement or set of instruction. In this case we
declare a variable (index = 0), a test (index < pincount), and
an increment (x++). Thirdly we must declare the sensorpin as an OUTPUT, pinMode(ledPins[index], OUTPUT);. These three steps must be repeated for the second array of LED’s as shown on the image below.
1 2 3 4 5 6 7 8 9 10 11 12 13 14 15 16 17 18 19 20 21 22 23 24 25 |
void setup() { int index; //Use an index to define the order placement of each pin. for(index = 0; index < pincount; index++) //Use a "for" statement to repeat a block statement. In this case we //declare a variable (index = 0), a test (index < pincount), and //an increment (x++). { pinMode(ledPins[index],OUTPUT); //Specify the arrayed pins as an output. States that LED is the result. } int index1; //Use an index to define the order placement of the pins on the second //array. for(index1 = 0; index1 < pincount1; index1++) //Repeat the block statement for the second array. { pinMode(ledPins1[index1],OUTPUT); //Specify the second list of arrayed pins as an output. } Serial.begin(9600); //"Serial.begin" performs an exchange of data between the arduino and a //sensor. In this case the photo resistors will capture data. } |
Void Loop
For the void loop we must indicate a light level. This will be determined by the read on the photo resistors. Therefore, we indicate lightLevel = analogRead(sensorPin). Keep in mind this is the read for the first sensor. The next step is important in manufacturing an applicable number range of light for Arduino. Because the range is primarily (0-1023) we must manually adjust it to smaller range suitable for, (0-255). This is input as manualTune(), but is further developed as its on void after the void loop instructions.
Our next step is to identify our data received from the photo resistor and construct an instruction for the LED’s based on the data received. For this we create a “for” statement to create a set of instruction for each of the LED’s for (index = 0; index < pincount; indext++). This shows the variable, the test variable and an instruction.
We now want to tell the LED Pins where to start and what to do when receiving data. We start with an off light, analogWrite(ledPins[index], 0 or LOW);. When the photo resistor receives no evidence of light we want the LED to turn on, so we write analogWrite(ledPins[index], (lightLevel));. Add delay after this whole process to ensure that data readings are not being read simultaneously but one after the other. Repeat this process for the second array of LEDs withing the void loop.
1 2 3 4 5 6 7 8 9 10 11 12 13 14 15 16 17 18 19 20 21 22 23 24 25 26 27 28 29 30 31 32 33 34 35 36 37 38 39 40 41 42 43 44 45 46 47 48 49 50 51 52 53 |
void loop() { int index; //Refers to the order of the LEDs lightLevel = analogRead(sensorPin); //Set lightLevel to equate to the data received by the arduino from the //first light resistor. manualTune(); //This is defined in the void after the void loop. It is used to //accomodate the light range reading because the light sensing circuit //cannot read the range primarily used, this being 0 to 1023. Therefore //we create a smaller range. (300 to 800) We can reduce the large number //to adjust brightness. Serial.print(lightLevel); //"Serial.print" types the data received from the photo resister and //displays it on the serial monitor. for (index = 0; index < pincount; index++) //"for" is once again used to create a block sttatement and instructions. //This one is specified for the first array. { analogWrite(ledPins[index], 0); //Instructs the first array to commence the LEDs at a power of 0. analogWrite(ledPins[index], (lightLevel)); //Instructs the first aray to turn on in response to light level change. delay(lightLevel); } delay(10); //This delay is specific for getting two readings of data one at a time //as opposed to attempting to read data at the same time. int index1; //Place an index reading for the second array of pins. lightLevel = analogRead(sensorPin1); //Defines the light level to eaqual the reading of the light resistor //data. manualTune(); //Interpret value to read Serial.println( lightLevel); //Prints the data from registered from the second light resistor. for (index1 = 0; index1 < pincount1; index1++) //Create a block statement for the the second array of LEDs. { analogWrite(ledPins1[index1], 0); //Determines the intial state of the first group of LEDs. analogWrite(ledPins1[index1], (lightLevel)); //Is a secondary step for the second array in response to the second //light resistor reading. delay(lightLevel); } } |
Manual Tune
Our final step is defining the manualTune called out in the void loop. This simply re-maps the large range light values to a range more manageable for the LED. So we describe a void manualTune(). We indicate the range we want to replace (0-1023) and place the new range (0-255), lightLevel = map(lightLevel, 0, 1023, 0, 255). Are last step is determining the new constraint of the range, lightLevel = constrain(lightLevel, 0, 255);.
|
|
void manualTune() //This is the void used in the void loop that helps redefine the //boundaries of light level. Because the range is too great, we reduce //the range. (300-800) Has been used as a typical range. { lightLevel = map(lightLevel, 0, 1023, 0, 255); //This infers the change in light values. The first range (0-1023) is //remapped as a range of (0-255). lightLevel = constrain(lightLevel, 0, 255); //Defines the new constraints of the range. } |
Each photo resistor should be accommodated to 3 pins and respond to its condition within its environment.

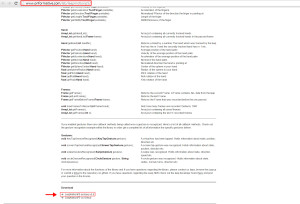
Reference
http://arduino.cc/en/Reference/HomePage
http://www.hackerscapes.com/2014/09/lab-4-communicating/