Introduction:
In this tutorial it will be explained that how buzzer reacts to a specific RGB color. For example, it could be an alarm for specific situation, which is defined by colors. That is, as the color of RGB changes, the alarm sound changes and has a specific meaning.
Note: This tutorial only focuses on one color and one sound. Based on, different voltage and different RGB colors, buzzer could be applied for more kinds of notes and sounds.
Parts list:
• Arduino UNO (1)
• Breadboard (1)
• RGB LED (1)
• Jumper wire (11)
• 330 Ohm resistor (3)
• Piezo element (1)
• Potentiometer (1)
How to set up:
The first thing should be done is assembling all parts on the breadboard. Then, start coding.
Note1: Be sure that RGB led legs are connected correctly (in terms of colors and Common leg which is connected to GND without resistor).
Note2: Most LEDs are designed to work with a voltage between 1.5v and 3v. As most microcontrollers (including the Arduino) operate on 5 volts a current limiting resistor is required.
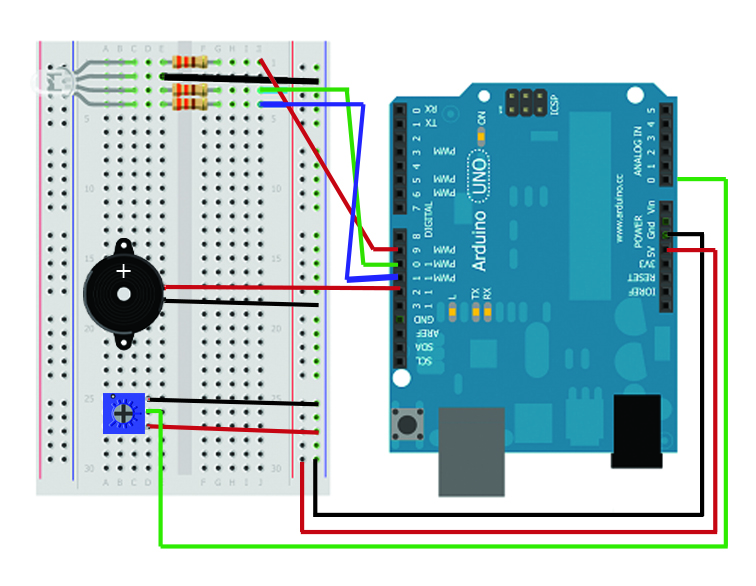
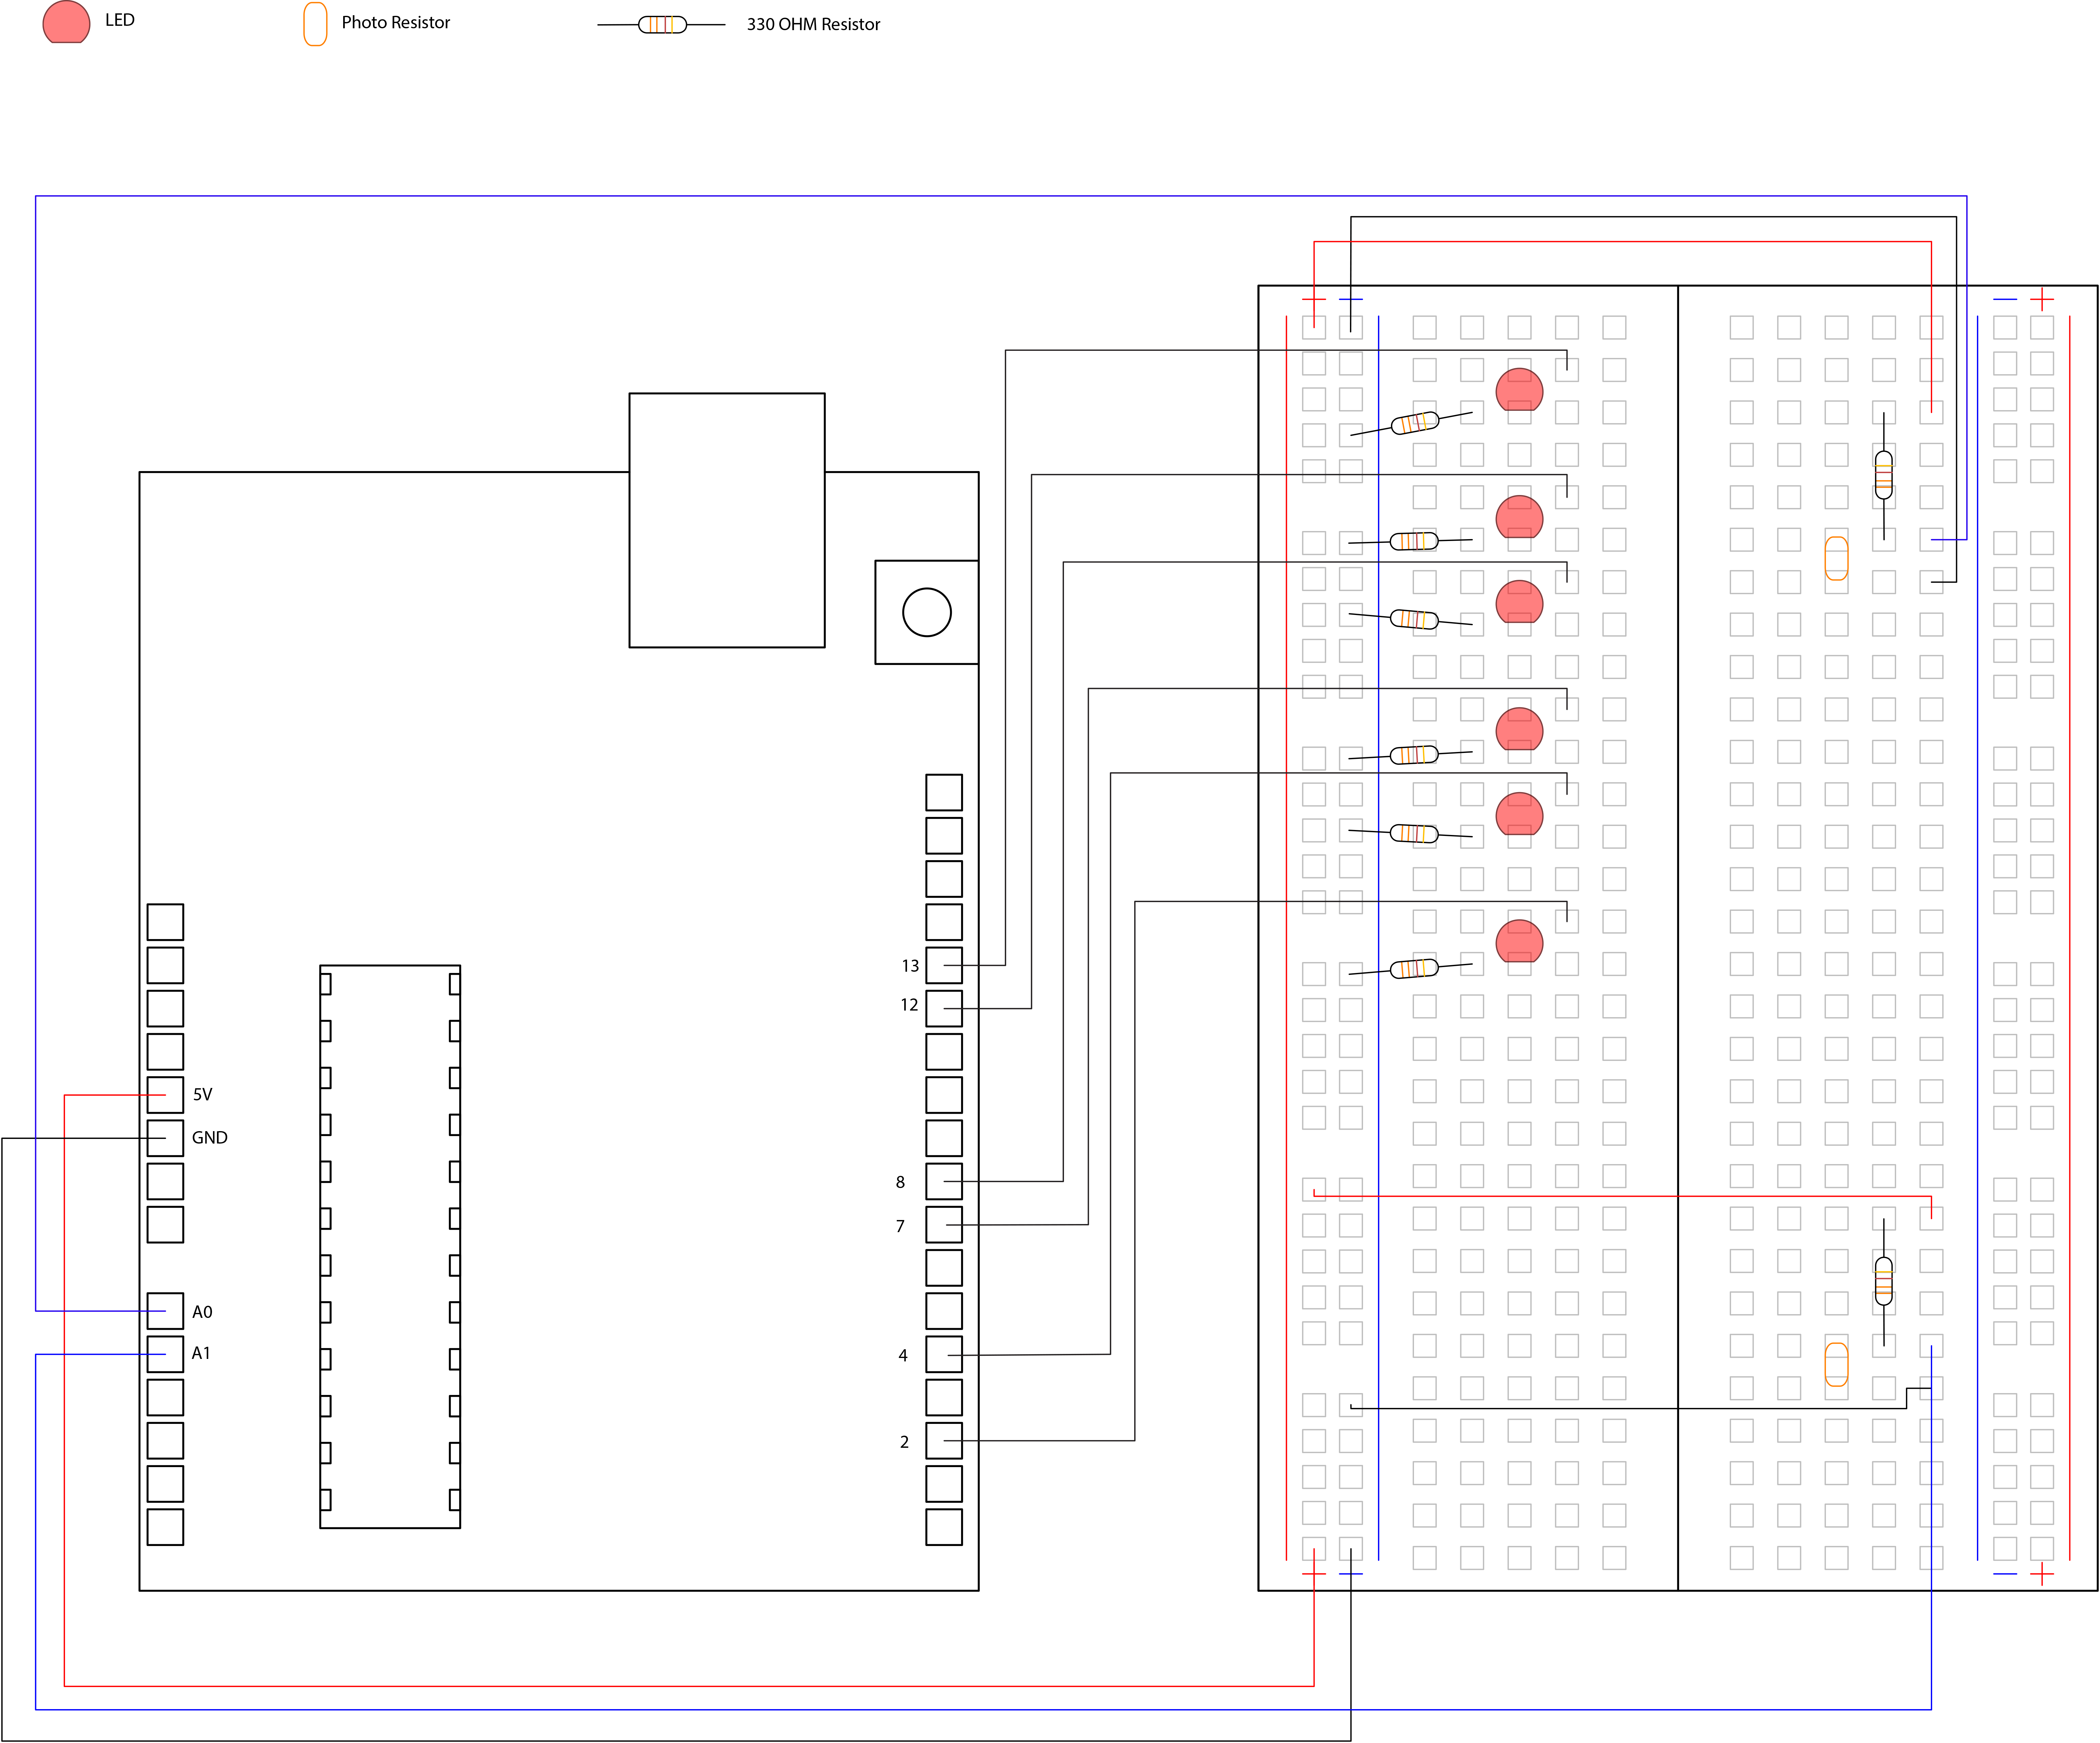
The following diagram shows how to assemble the parts on the breadboard:
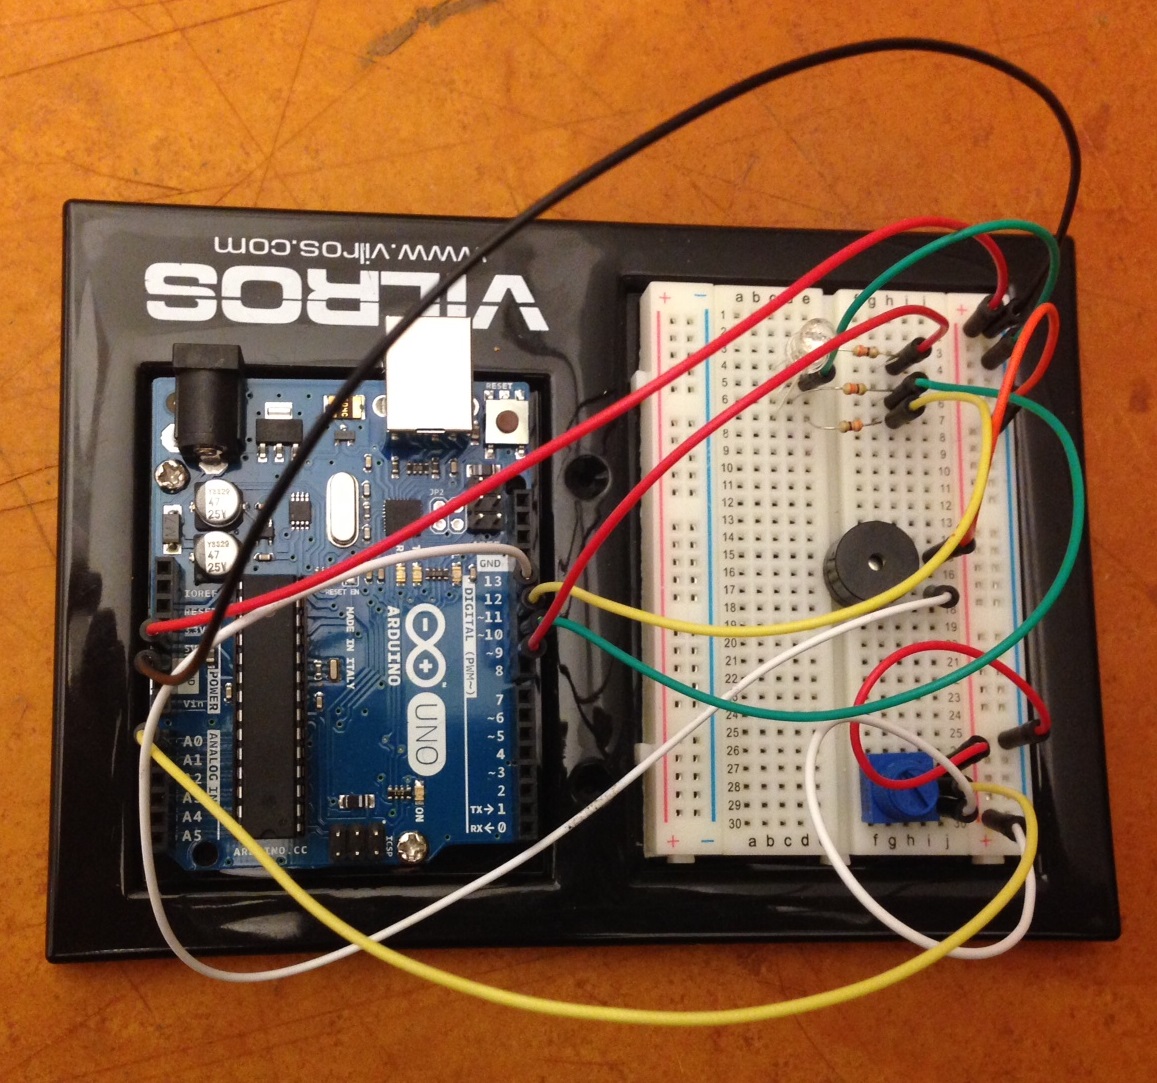
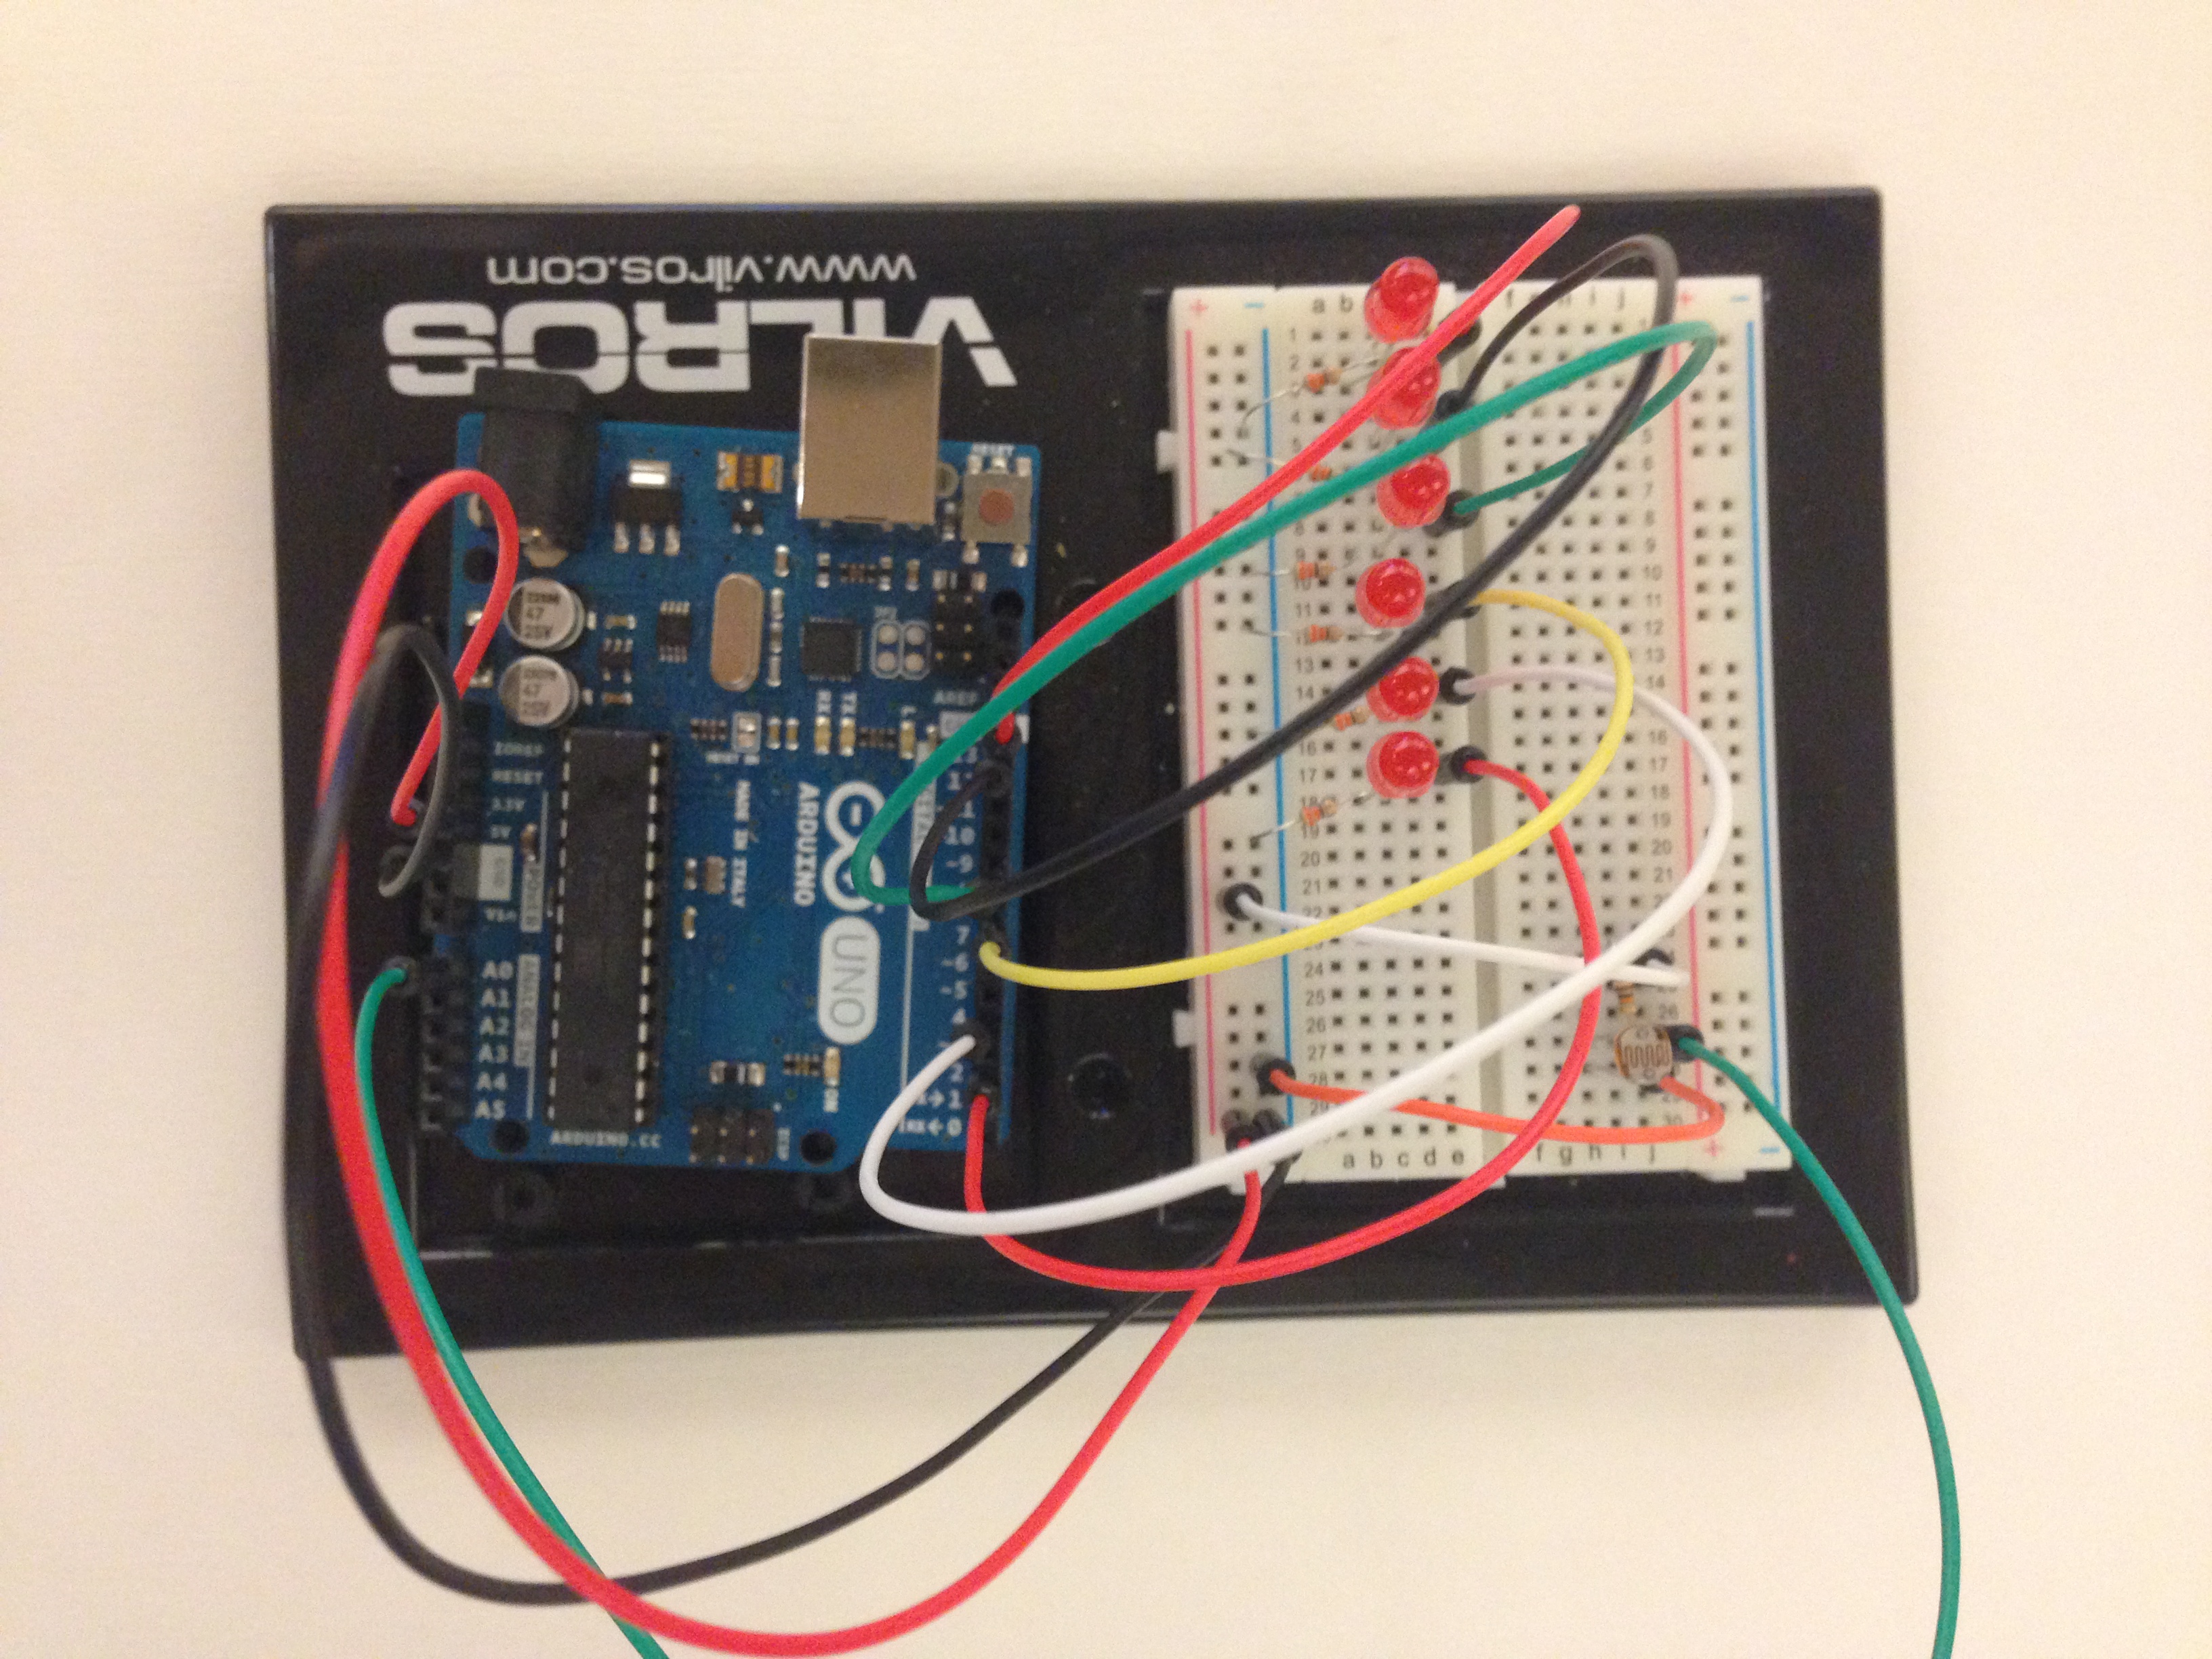
Your final assembly should be something like this:
Code:
Please note that your Arduino must not be connected to the computer. Otherwise, the power might damage or burn out the parts. The code is as follows and next to each part it is explained what each part does.
1
2
3
4
5
6
7
8
9
10
11
12
13
14
15
16
17
18
19
20
21
22
23
24
25
26
27
28
29
30
31
32
33
34
35
36
37
38
39
40
41
42
43
44
45
46
47
48
49
//BUZZER REACTS TO A SPECIFIC RGB LED COLOR:
//Mohammad Momenabadi
intred=9;//Digital pin9 for red led
intgreen=10;//Digital pin10 for green led
intblue=11;//Digital pin11 for blue led
// This verifies the pins for RGB led light on the board
intsound=12;//Digital pin for piezo buzzer
intsensorpin=0;// The potentiometer is connected to analog pin 0
intsensorValue=0;//introducing vriable
voidsetup()//method runs once, when the sketch starts
{
pinMode(red,OUTPUT);// initialize the digital pin as an output
pinMode(green,OUTPUT);
pinMode(blue,OUTPUT);
pinMode(sound,OUTPUT);
Serial.begin(9600);//initialize serial communication at 9600 bits per second
}
voidloop()// the loop() method runs over and over again
{
sensorValue=analogRead(sensorpin);// read the value from the sensor
Serial.println(sensorValue);// print out the value you read
if(sensorValue>0&&sensorValue<=200)//if voltage value is between 0 and 200, do next step
{
analogWrite(blue,000);
analogWrite(red,255);//turn the red light on
analogWrite(green,000);
digitalWrite(sound,HIGH);//Piezo sing
}
else
{
analogWrite(blue,000);
analogWrite(red,000);
analogWrite(green,255);//turn the green light on
digitalWrite(sound,LOW);//Piezo silence
}
}
Now to see the result, plug in your Arduino, upload your code and tern the potentiometer. The result should be like this video: Video
This tutorial describes how to control two sets of multiple LEDs using two photo resistor sensors. This is a lab responsive to different light conditions in one setting so as for lights to react appropriately to its particular conditions. This procedure will define how to set up an array of lights and how to adjust them into two groups for each to respond to its particular light resistor reading. In essence, the overall goal will be to achieve responsive lighting as an effect of multiple data collections.
The parts list:
1. Arduino UNO
2. 6 LED lights
3. 6 330 Ohm Resistors
4. 2 Photo Resistors
5. 2 10k Ohm resistors
6. Jumper Wires
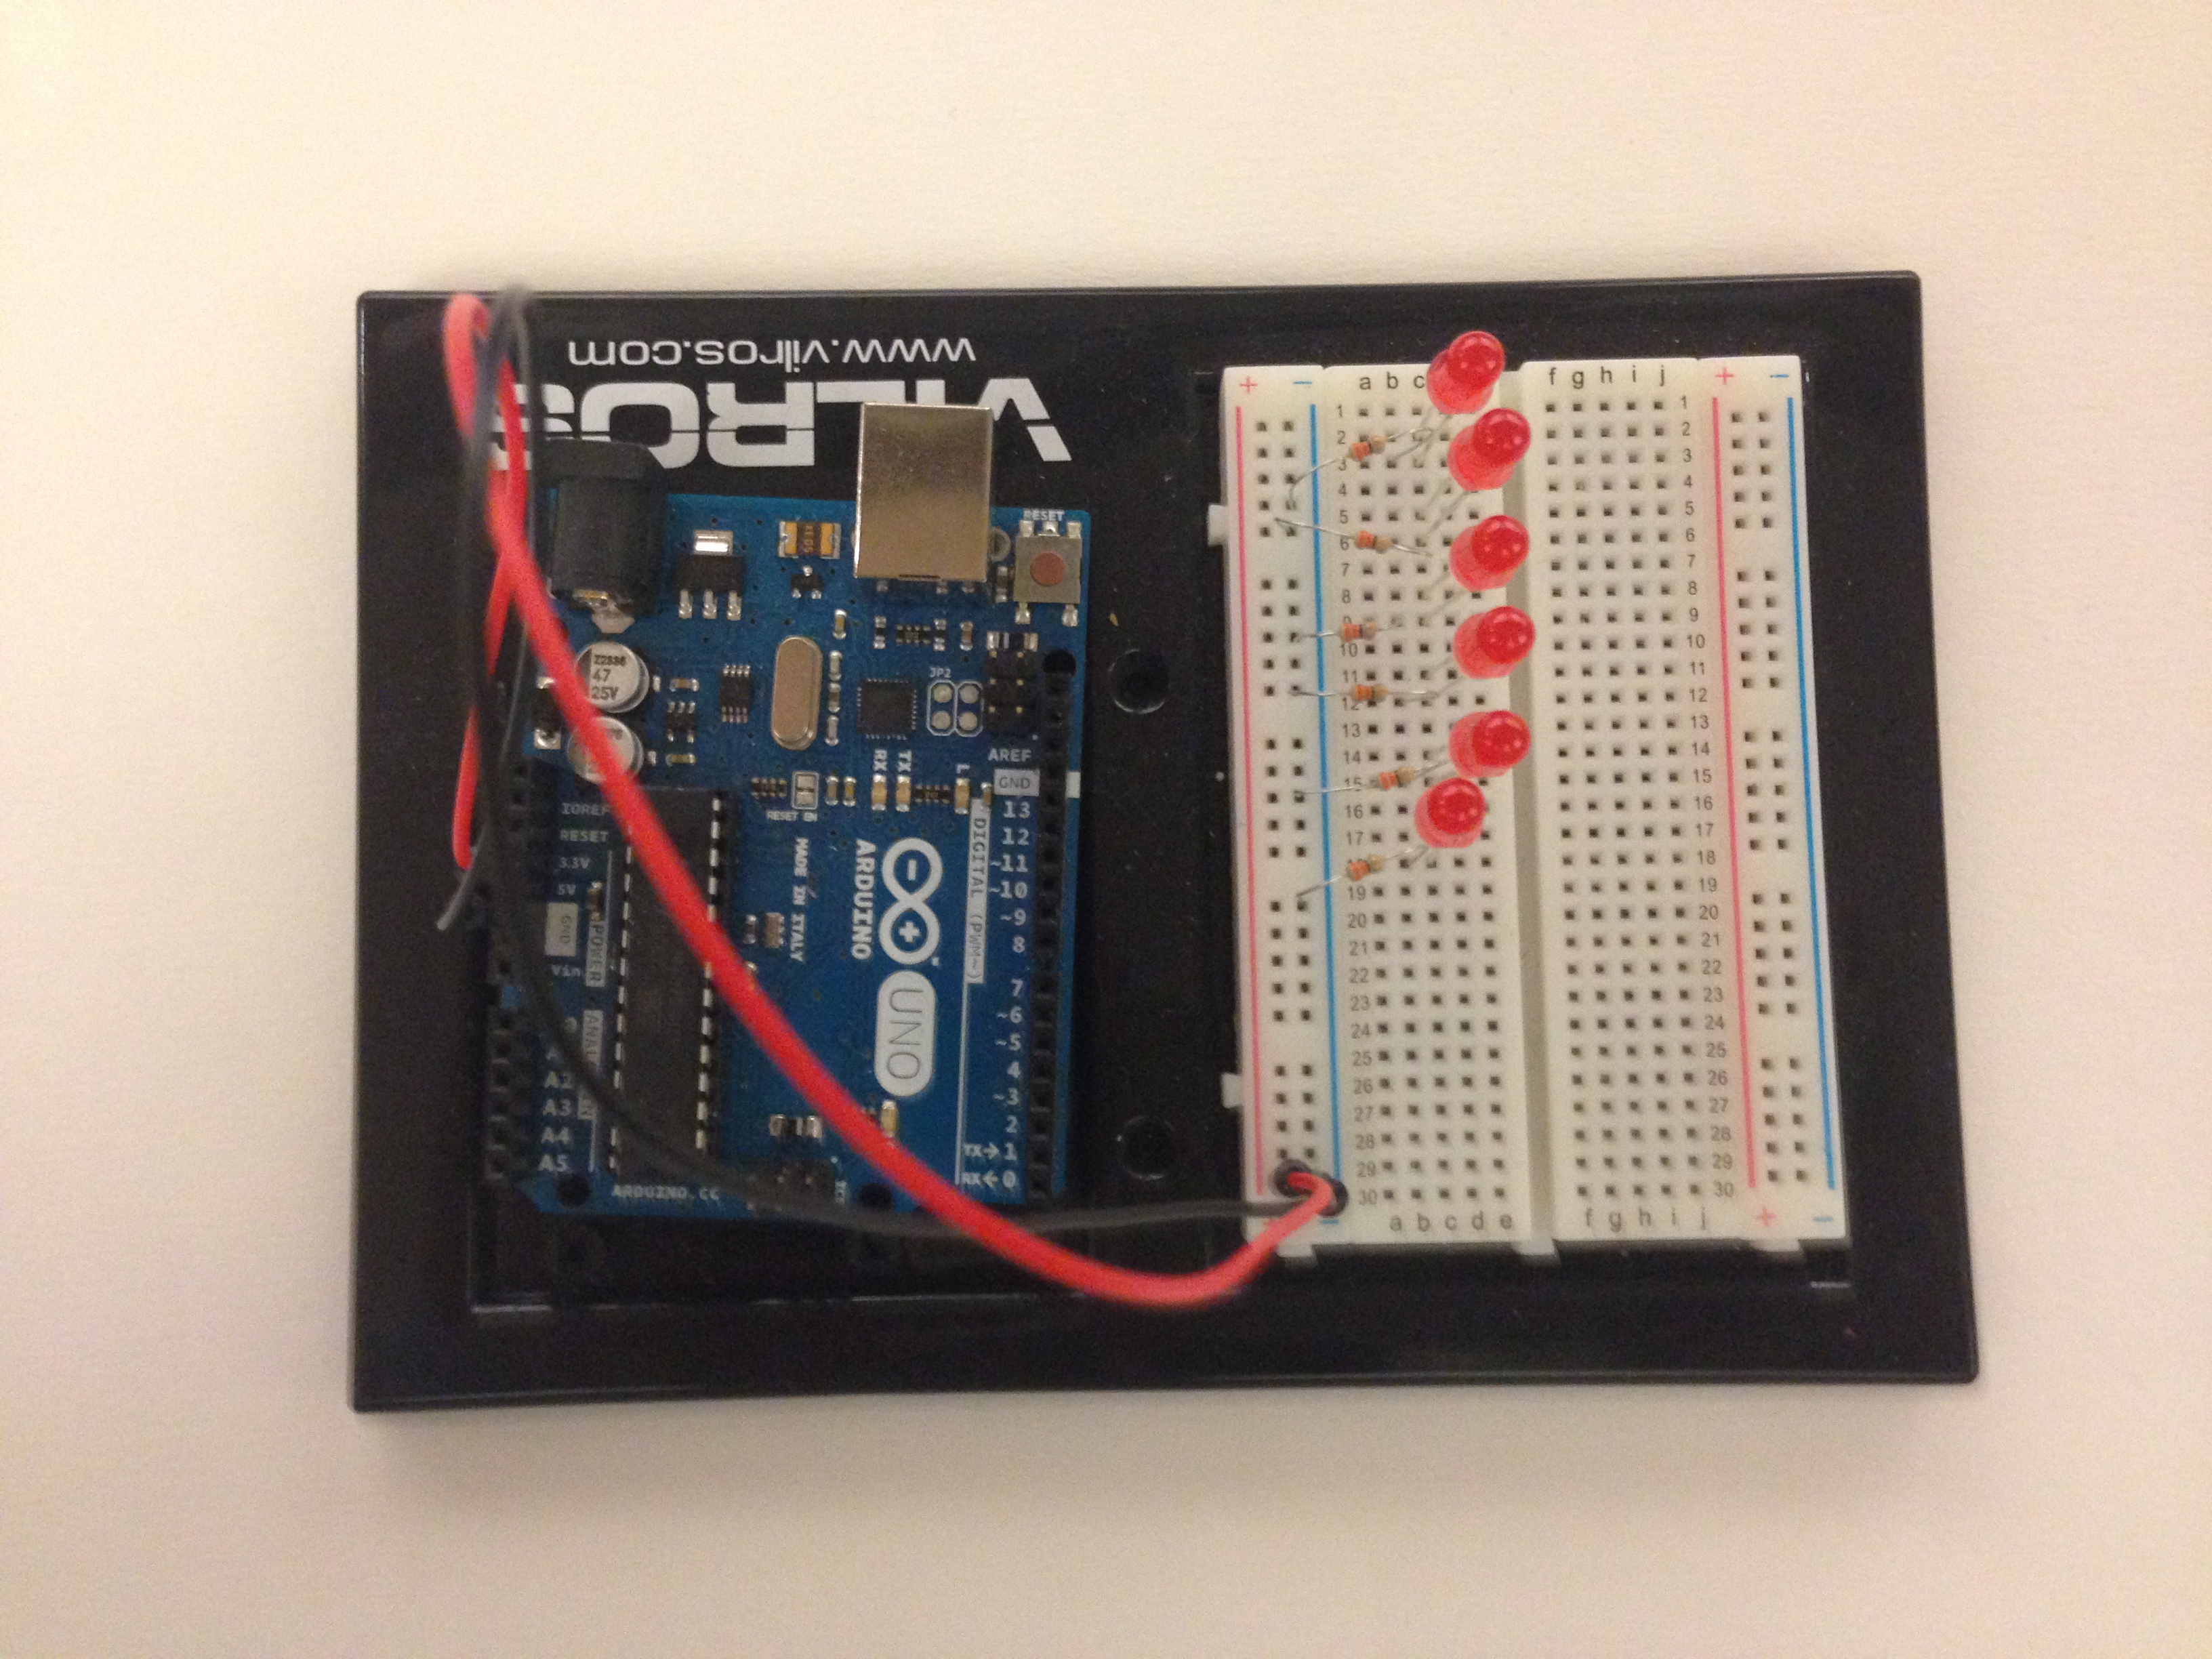
Step 1 Setting LED’s
We will first place a wire connecting 5V to a positive strip of the breadboard and a wire connecting ground (GND) to a negative strip of the breadboard.
We will now begin placing the 6 LED’s onto the breadboard. Each LED is placed round side up (positive) and flat side down (negative). The LED wires should be aligned on the y-axis. Give adequate space from LED to LED, in this sample they are spaced by one block apart. The next step is to apply the 330 Ohm resistors. Each LED should contain one 330 Ohm resistor connected to its negative or flat side of the LED and grounded onto the negative strip of the breadboard.
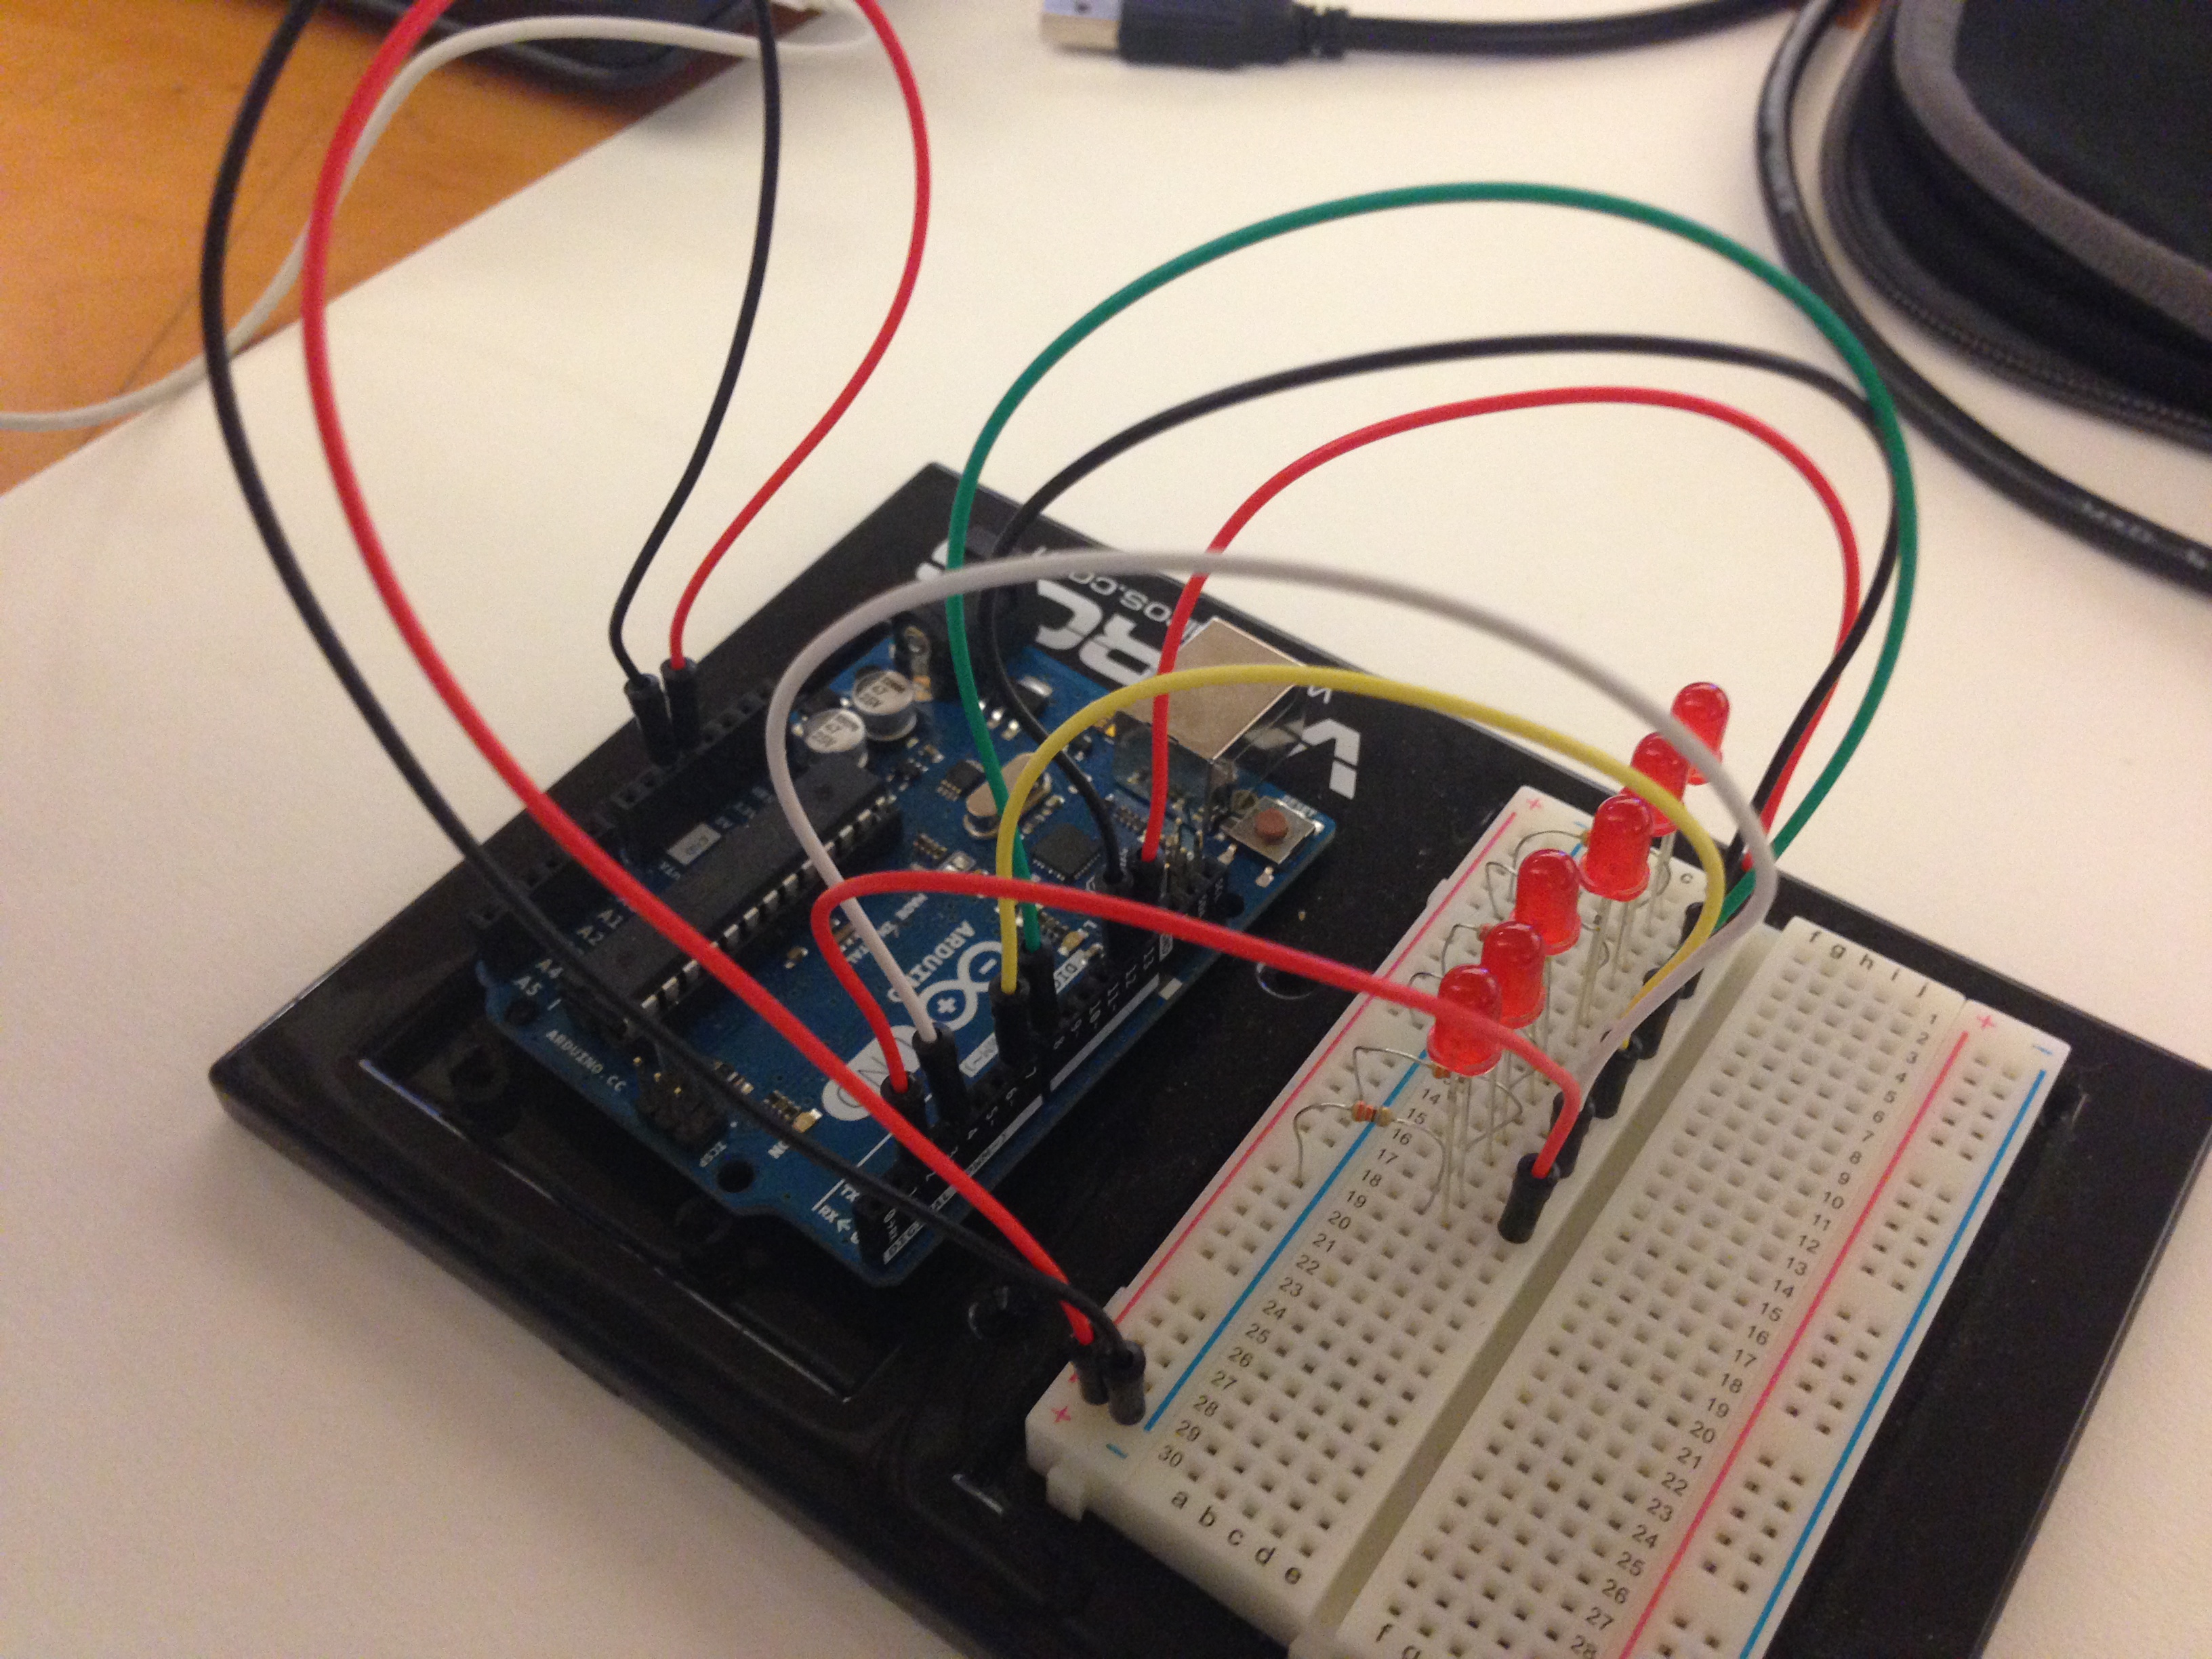
The next step is to apply a pin number to each of the LED’s. In this sample we have avoided the use of TX, RX and PWM pins (0, 1, 3, 5, 6, 9, 10, 11) due to malfunction in the reception of instruction for each LED. We have applied a pin to the positive side of each LED. We utilized pin 13, 12, 8, 7, 4, and 2 and applied it in such order from top to bottom.
Step 2 Setting Photo Resistors
For the second step we must apply the photo resistors. We apply one of them aligned to the y-axis. We then apply a 10k resistor also aligned to the y-axis. The bottom of the 10k resistor should be on the same line as the top of the photo resistor. Also, the top of the 10k resistor must be connected to the 5V using a wire connected to the positive strip of the breadboard. (Refer to drawing). The bottom of the photo resistor must also be grounded. Last but not least, the photo resistor must be given a pin for it to register data. For this we will use an analog pin A0. Repeat the same process using different squares on the breadboard for the second photo resistor. The only difference for the second photo resistor will be the assigned analog pin, analog pin A1.
We start the code by stating all the pins in use. First we indicate both analog pins A0 and A1. Second we create two arrays each storing a separate group of pins. We grouped pins 13, 12 and 8 into one and 7, 4, and 2 on the pin A1. We also require a pincount for each of the arrays. Each has a specific name and the number of pins per group, in this case 3 per array.
1
2
3
4
5
6
7
8
9
10
11
12
13
14
15
16
intsensorPin=0;
//Connect photo resistor to analog pin A0.
intsensorPin1=1;
//Connect a second photoresistor to analog pin A1.
intledPins[]={8,12,13};
//Create an array to list a number of LEDs to control.(Note: in this
//array we have avoided using PWM pins, TX pin and RX pin.
intledPins1[]={2,4,7};
//Create a second array to list a seperate number of LEDS to control.
intpincount=3;
//Define the number of pins utilized in the first array.
intpincount1=3;
//Define the number of pins utilized in the second array.
intlightLevel,high=0,low=1023;
//Define the global vairables for thhe light level.
Void Setup
The next step is setting the void set up. Here we will setup an index to organize the pin order. We will also use a “for” statement to repeat a block statement or set of instruction. In this case we
declare a variable (index = 0), a test (index < pincount), and
an increment (x++). Thirdly we must declare the sensorpin as an OUTPUT, pinMode(ledPins[index], OUTPUT);. These three steps must be repeated for the second array of LED’s as shown on the image below.
1
2
3
4
5
6
7
8
9
10
11
12
13
14
15
16
17
18
19
20
21
22
23
24
25
voidsetup()
{
intindex;
//Use an index to define the order placement of each pin.
for(index=0;index<pincount;index++)
//Use a "for" statement to repeat a block statement. In this case we
//declare a variable (index = 0), a test (index < pincount), and
//an increment (x++).
{
pinMode(ledPins[index],OUTPUT);
//Specify the arrayed pins as an output. States that LED is the result.
}
intindex1;
//Use an index to define the order placement of the pins on the second
//array.
for(index1=0;index1<pincount1;index1++)
//Repeat the block statement for the second array.
{
pinMode(ledPins1[index1],OUTPUT);
//Specify the second list of arrayed pins as an output.
}
Serial.begin(9600);
//"Serial.begin" performs an exchange of data between the arduino and a
//sensor. In this case the photo resistors will capture data.
}
Void Loop
For the void loop we must indicate a light level. This will be determined by the read on the photo resistors. Therefore, we indicate lightLevel = analogRead(sensorPin). Keep in mind this is the read for the first sensor. The next step is important in manufacturing an applicable number range of light for Arduino. Because the range is primarily (0-1023) we must manually adjust it to smaller range suitable for, (0-255). This is input as manualTune(), but is further developed as its on void after the void loop instructions.
Our next step is to identify our data received from the photo resistor and construct an instruction for the LED’s based on the data received. For this we create a “for” statement to create a set of instruction for each of the LED’s for (index = 0; index < pincount; indext++). This shows the variable, the test variable and an instruction.
We now want to tell the LED Pins where to start and what to do when receiving data. We start with an off light, analogWrite(ledPins[index], 0 or LOW);. When the photo resistor receives no evidence of light we want the LED to turn on, so we write analogWrite(ledPins[index], (lightLevel));. Add delay after this whole process to ensure that data readings are not being read simultaneously but one after the other. Repeat this process for the second array of LEDs withing the void loop.
1
2
3
4
5
6
7
8
9
10
11
12
13
14
15
16
17
18
19
20
21
22
23
24
25
26
27
28
29
30
31
32
33
34
35
36
37
38
39
40
41
42
43
44
45
46
47
48
49
50
51
52
53
voidloop()
{
intindex;
//Refers to the order of the LEDs
lightLevel=analogRead(sensorPin);
//Set lightLevel to equate to the data received by the arduino from the
//first light resistor.
manualTune();
//This is defined in the void after the void loop. It is used to
//accomodate the light range reading because the light sensing circuit
//cannot read the range primarily used, this being 0 to 1023. Therefore
//we create a smaller range. (300 to 800) We can reduce the large number
//to adjust brightness.
Serial.print(lightLevel);
//"Serial.print" types the data received from the photo resister and
//displays it on the serial monitor.
for(index=0;index<pincount;index++)
//"for" is once again used to create a block sttatement and instructions.
//This one is specified for the first array.
{
analogWrite(ledPins[index],0);
//Instructs the first array to commence the LEDs at a power of 0.
analogWrite(ledPins[index],(lightLevel));
//Instructs the first aray to turn on in response to light level change.
delay(lightLevel);
}
delay(10);
//This delay is specific for getting two readings of data one at a time
//as opposed to attempting to read data at the same time.
intindex1;
//Place an index reading for the second array of pins.
lightLevel=analogRead(sensorPin1);
//Defines the light level to eaqual the reading of the light resistor
//data.
manualTune();
//Interpret value to read
Serial.println(lightLevel);
//Prints the data from registered from the second light resistor.
for(index1=0;index1<pincount1;index1++)
//Create a block statement for the the second array of LEDs.
{
analogWrite(ledPins1[index1],0);
//Determines the intial state of the first group of LEDs.
analogWrite(ledPins1[index1],(lightLevel));
//Is a secondary step for the second array in response to the second
//light resistor reading.
delay(lightLevel);
}
}
Manual Tune
Our final step is defining the manualTune called out in the void loop. This simply re-maps the large range light values to a range more manageable for the LED. So we describe a void manualTune(). We indicate the range we want to replace (0-1023) and place the new range (0-255), lightLevel = map(lightLevel, 0, 1023, 0, 255). Are last step is determining the new constraint of the range, lightLevel = constrain(lightLevel, 0, 255);.
1
2
3
4
5
6
7
8
9
10
11
voidmanualTune()
//This is the void used in the void loop that helps redefine the
//boundaries of light level. Because the range is too great, we reduce
//the range. (300-800) Has been used as a typical range.
{
lightLevel=map(lightLevel,0,1023,0,255);
//This infers the change in light values. The first range (0-1023) is
//remapped as a range of (0-255).
lightLevel=constrain(lightLevel,0,255);
//Defines the new constraints of the range.
}
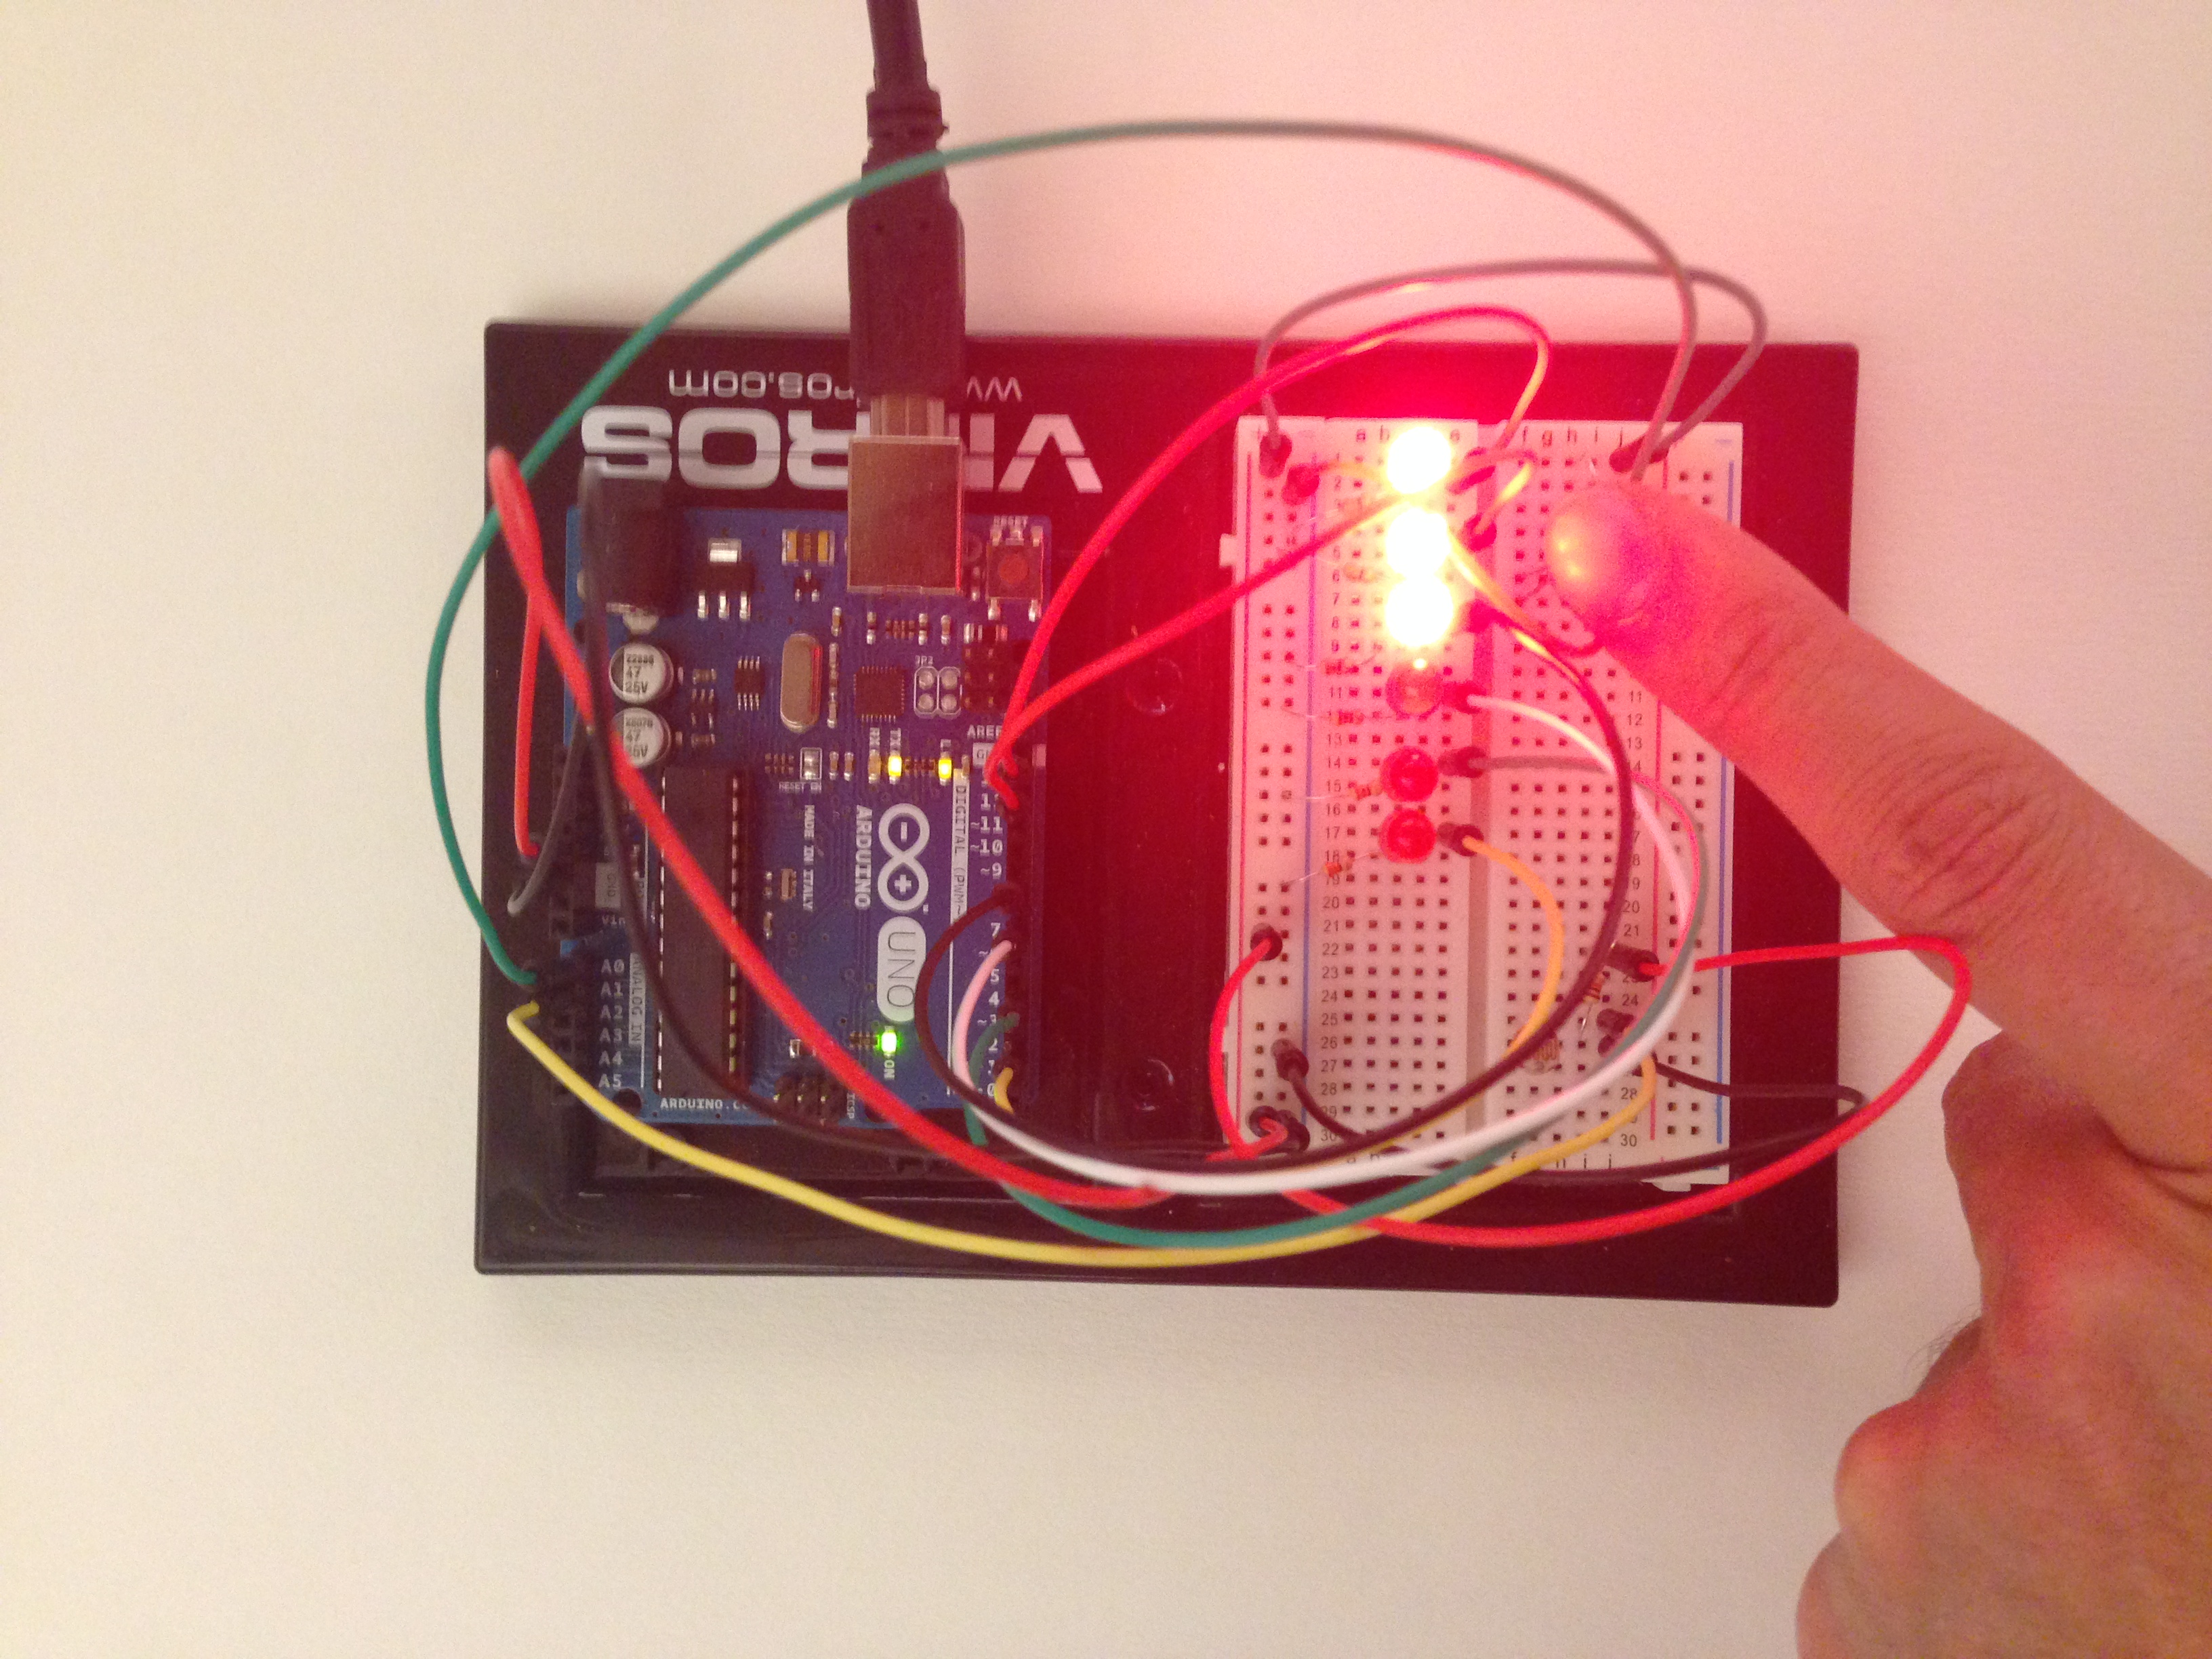
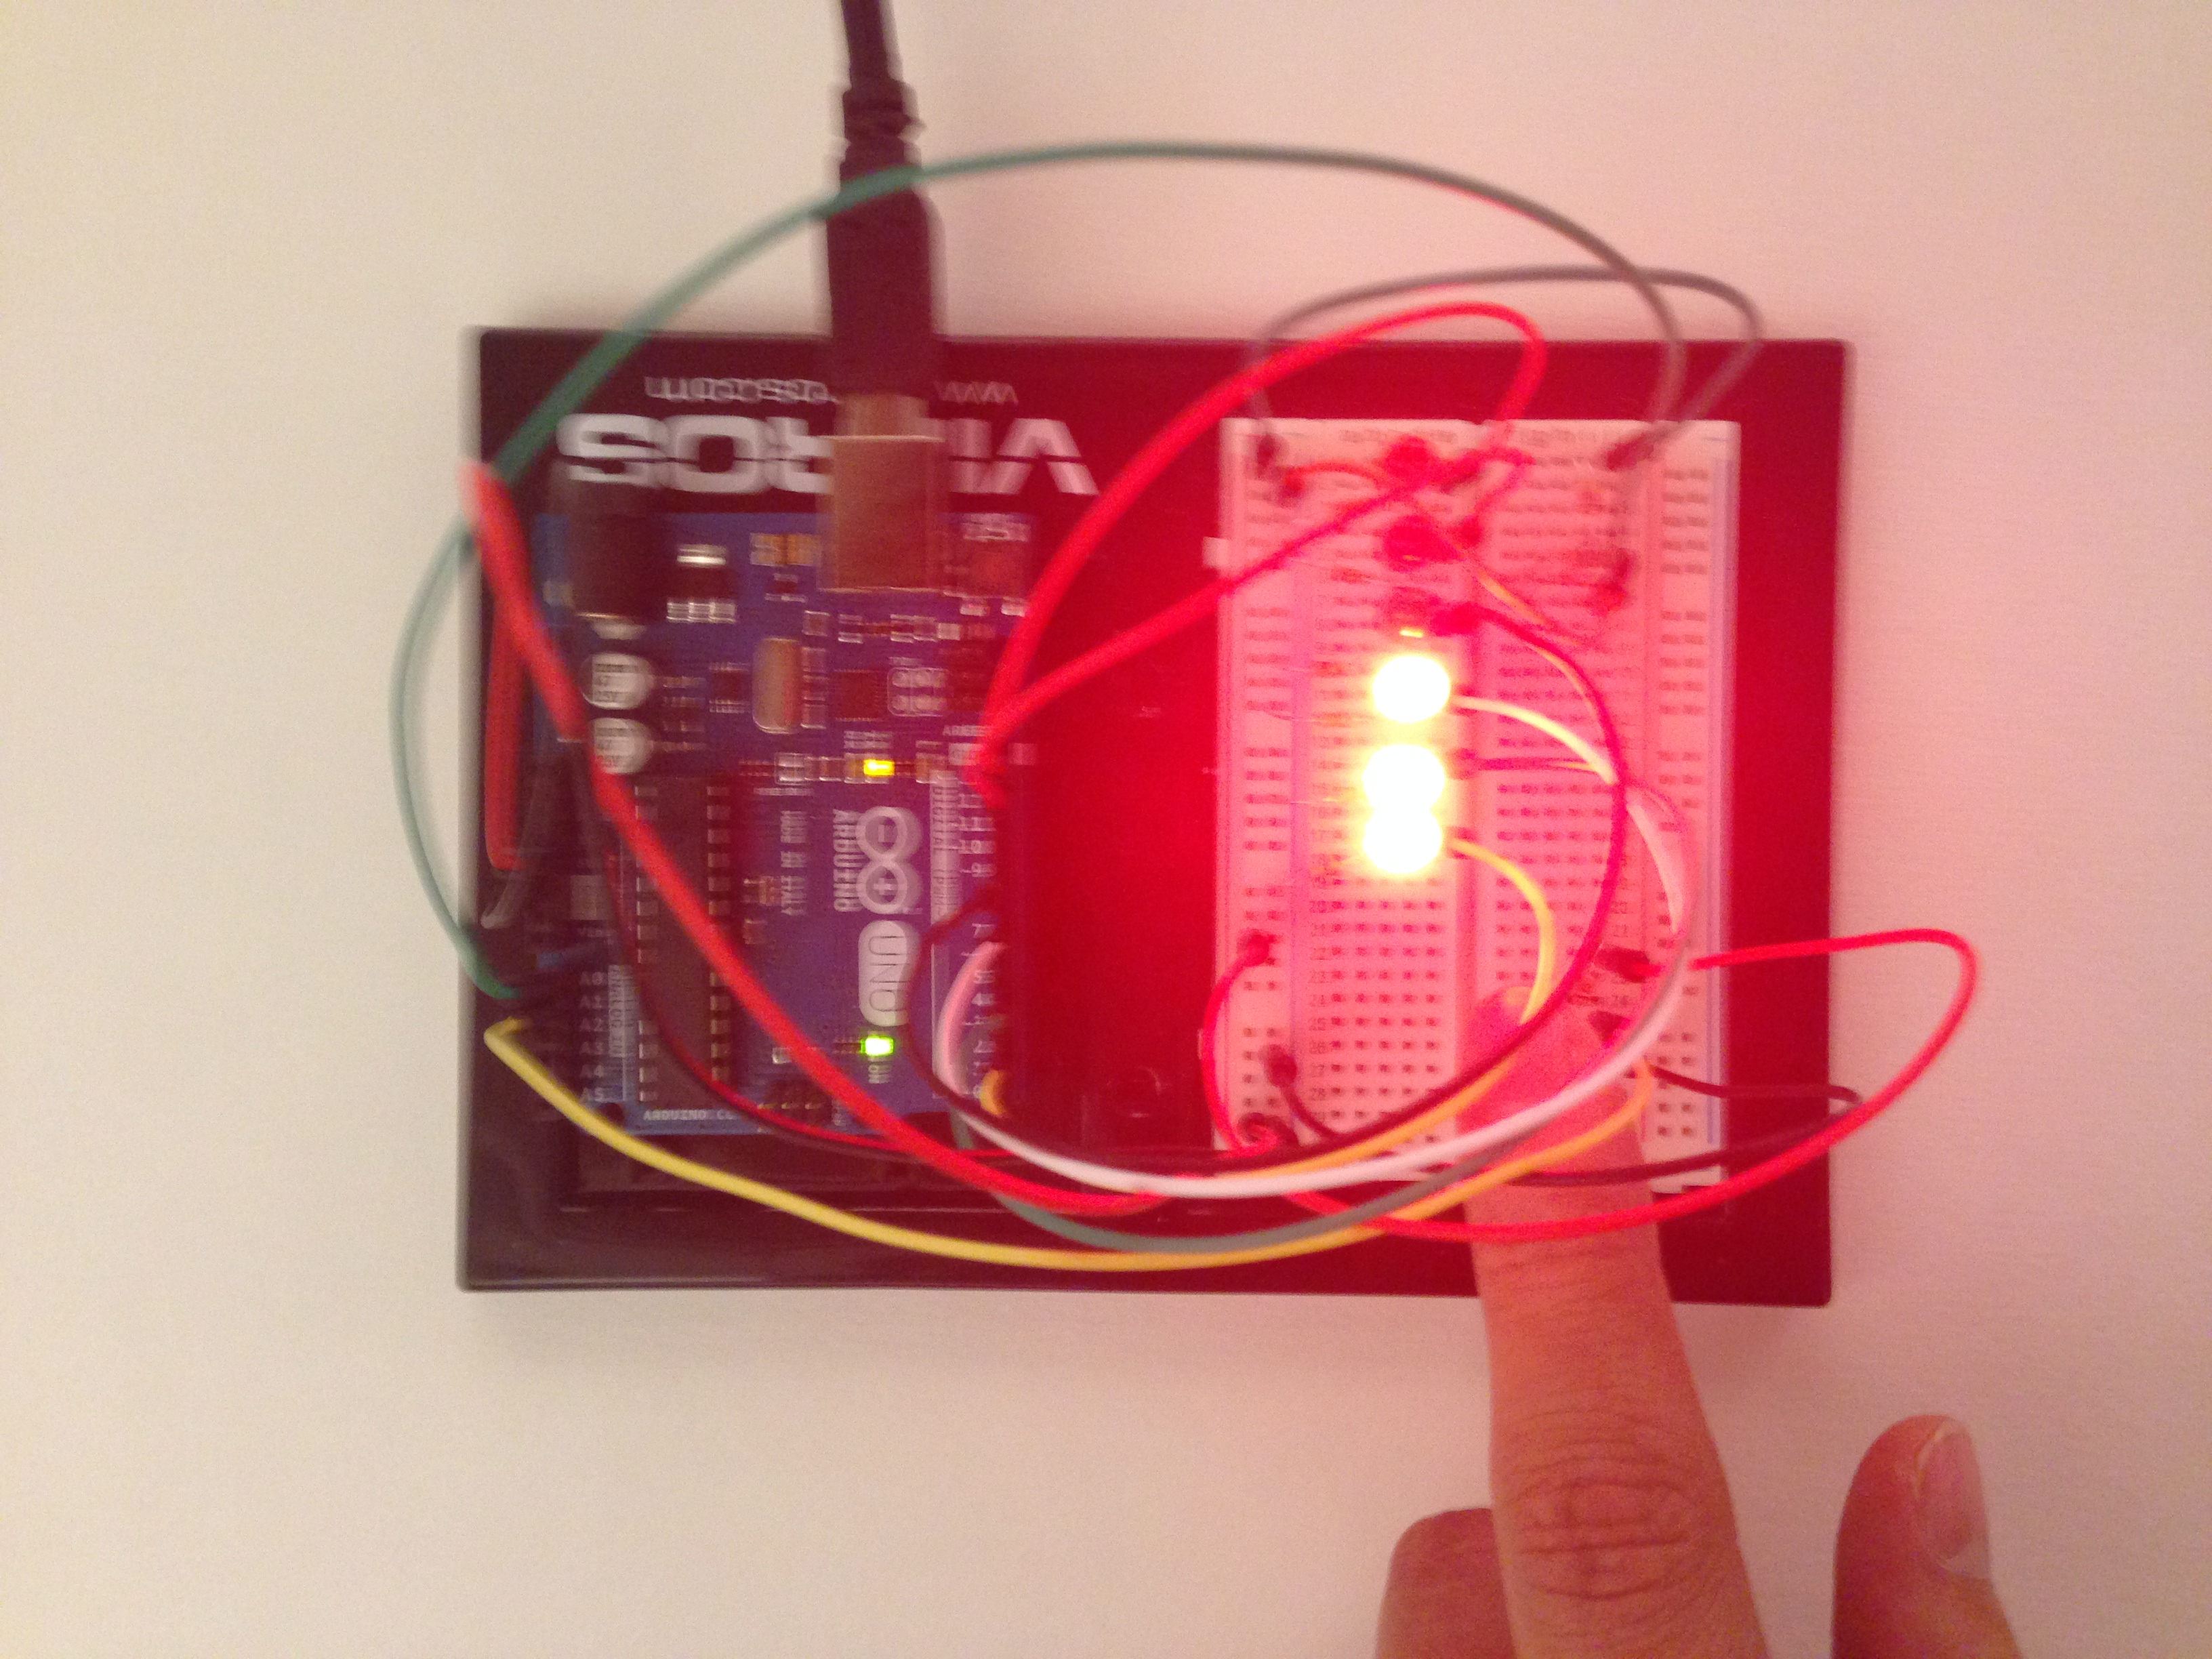
Each photo resistor should be accommodated to 3 pins and respond to its condition within its environment.
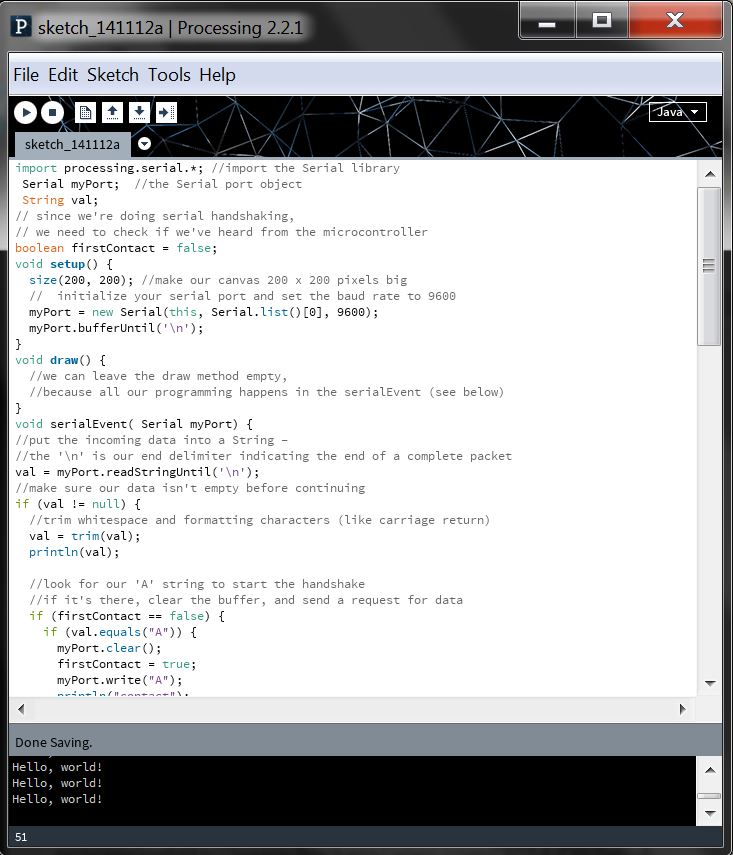
2. Here is a tutorial from Sparkfun to learn how to build the connection between Arduino and Processing .
3. So far we’ve shown that Arduino and Processing can communicate via serial that allows data to flow both ways. Coming after: making our servo rotate.
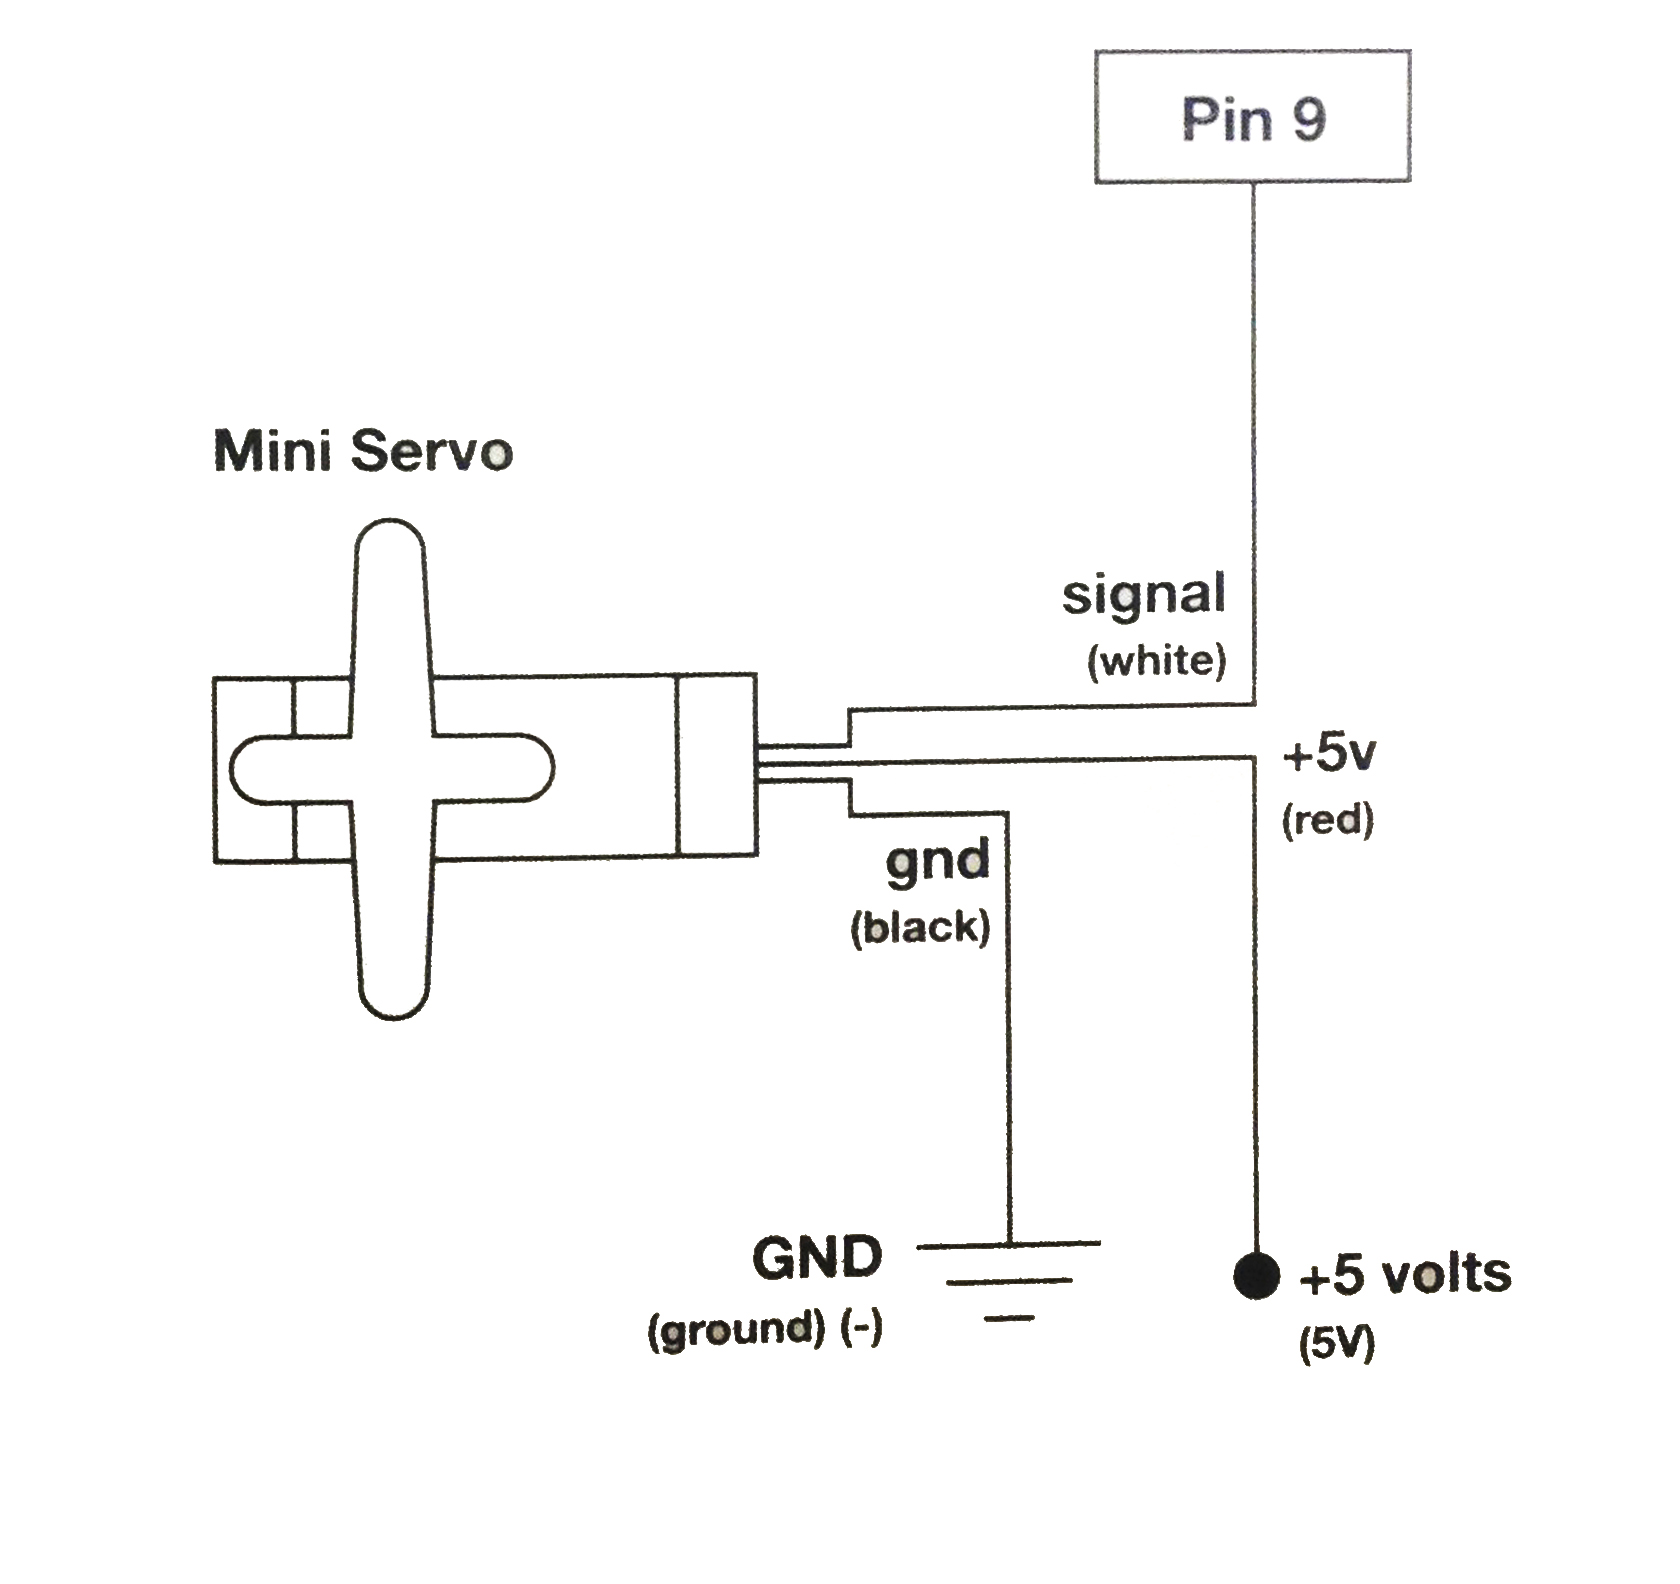
Power
Connect the red from servo to +5V on arduino.
Ground
Connect black/brown from servo to Gnd on arduino.
Signal
Connect white/orange from servo to pin~9 on arduino.
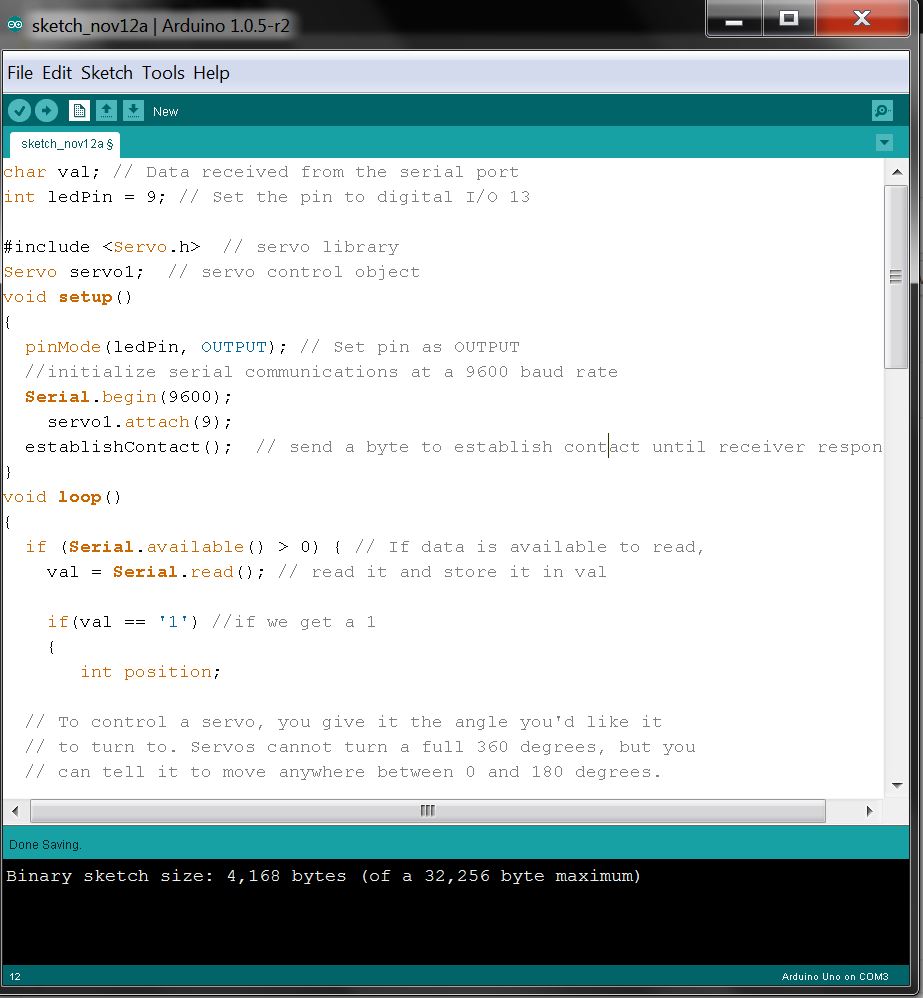
ARDUINO CODE
1
2
3
4
5
6
7
8
9
10
11
12
13
14
15
16
17
18
19
20
21
22
23
24
25
26
27
28
29
30
31
32
33
34
35
36
37
38
39
40
41
42
43
44
45
46
47
48
49
50
51
52
53
54
55
56
57
58
59
60
61
62
63
64
65
66
67
68
69
70
71
72
73
74
75
//The following code was written with the reference of the online links and example files mentioned below.
//initialize serial communications at a 9600 baud rate
Serial.begin(9600);
servo1.attach(9);
establishContact();// send a byte to establish contact until receiver responds
}
voidloop()
{
if(Serial.available()>0){// If data is available to read,
val=Serial.read();// read it and store it in val
if(val=='1')//if we get a 1
{
intposition;
// To control a servo, you give it the angle you'd like it
// to turn to. Servos cannot turn a full 360 degrees, but you
// can tell it to move anywhere between 0 and 180 degrees.
// Change position at full speed:
servo1.write(90);// Tell servo to go to 90 degrees
delay(1000);// Pause to get it time to move
servo1.write(180);// Tell servo to go to 180 degrees
delay(1000);// Pause to get it time to move
servo1.write(0);// Tell servo to go to 0 degrees
delay(1000);// Pause to get it time to move
// Change position at a slower speed:
// To slow down the servo's motion, we'll use a for() loop
// to give it a bunch of intermediate positions, with 20ms
// delays between them. You can change the step size to make
// the servo slow down or speed up. Note that the servo can't
// move faster than its full speed, and you won't be able
// to update it any faster than every 20ms.
// Tell servo to go to 180 degrees, stepping by two degrees
for(position=0;position<180;position+=2){servo1.write(position);// Move to next position delay(20); // Short pause to allow it to move } // Tell servo to go to 0 degrees, stepping by one degree for(position = 180; position >= 0; position -= 1)
{
servo1.write(position);// Move to next position
delay(20);// Short pause to allow it to move
}
delay(100);
}
else{
Serial.println("Hello, world!");//send back a hello world
delay(50);
}
}
}
voidestablishContact(){
while(Serial.available()<=0){
Serial.println("A");// send a capital A
delay(300);
}
}
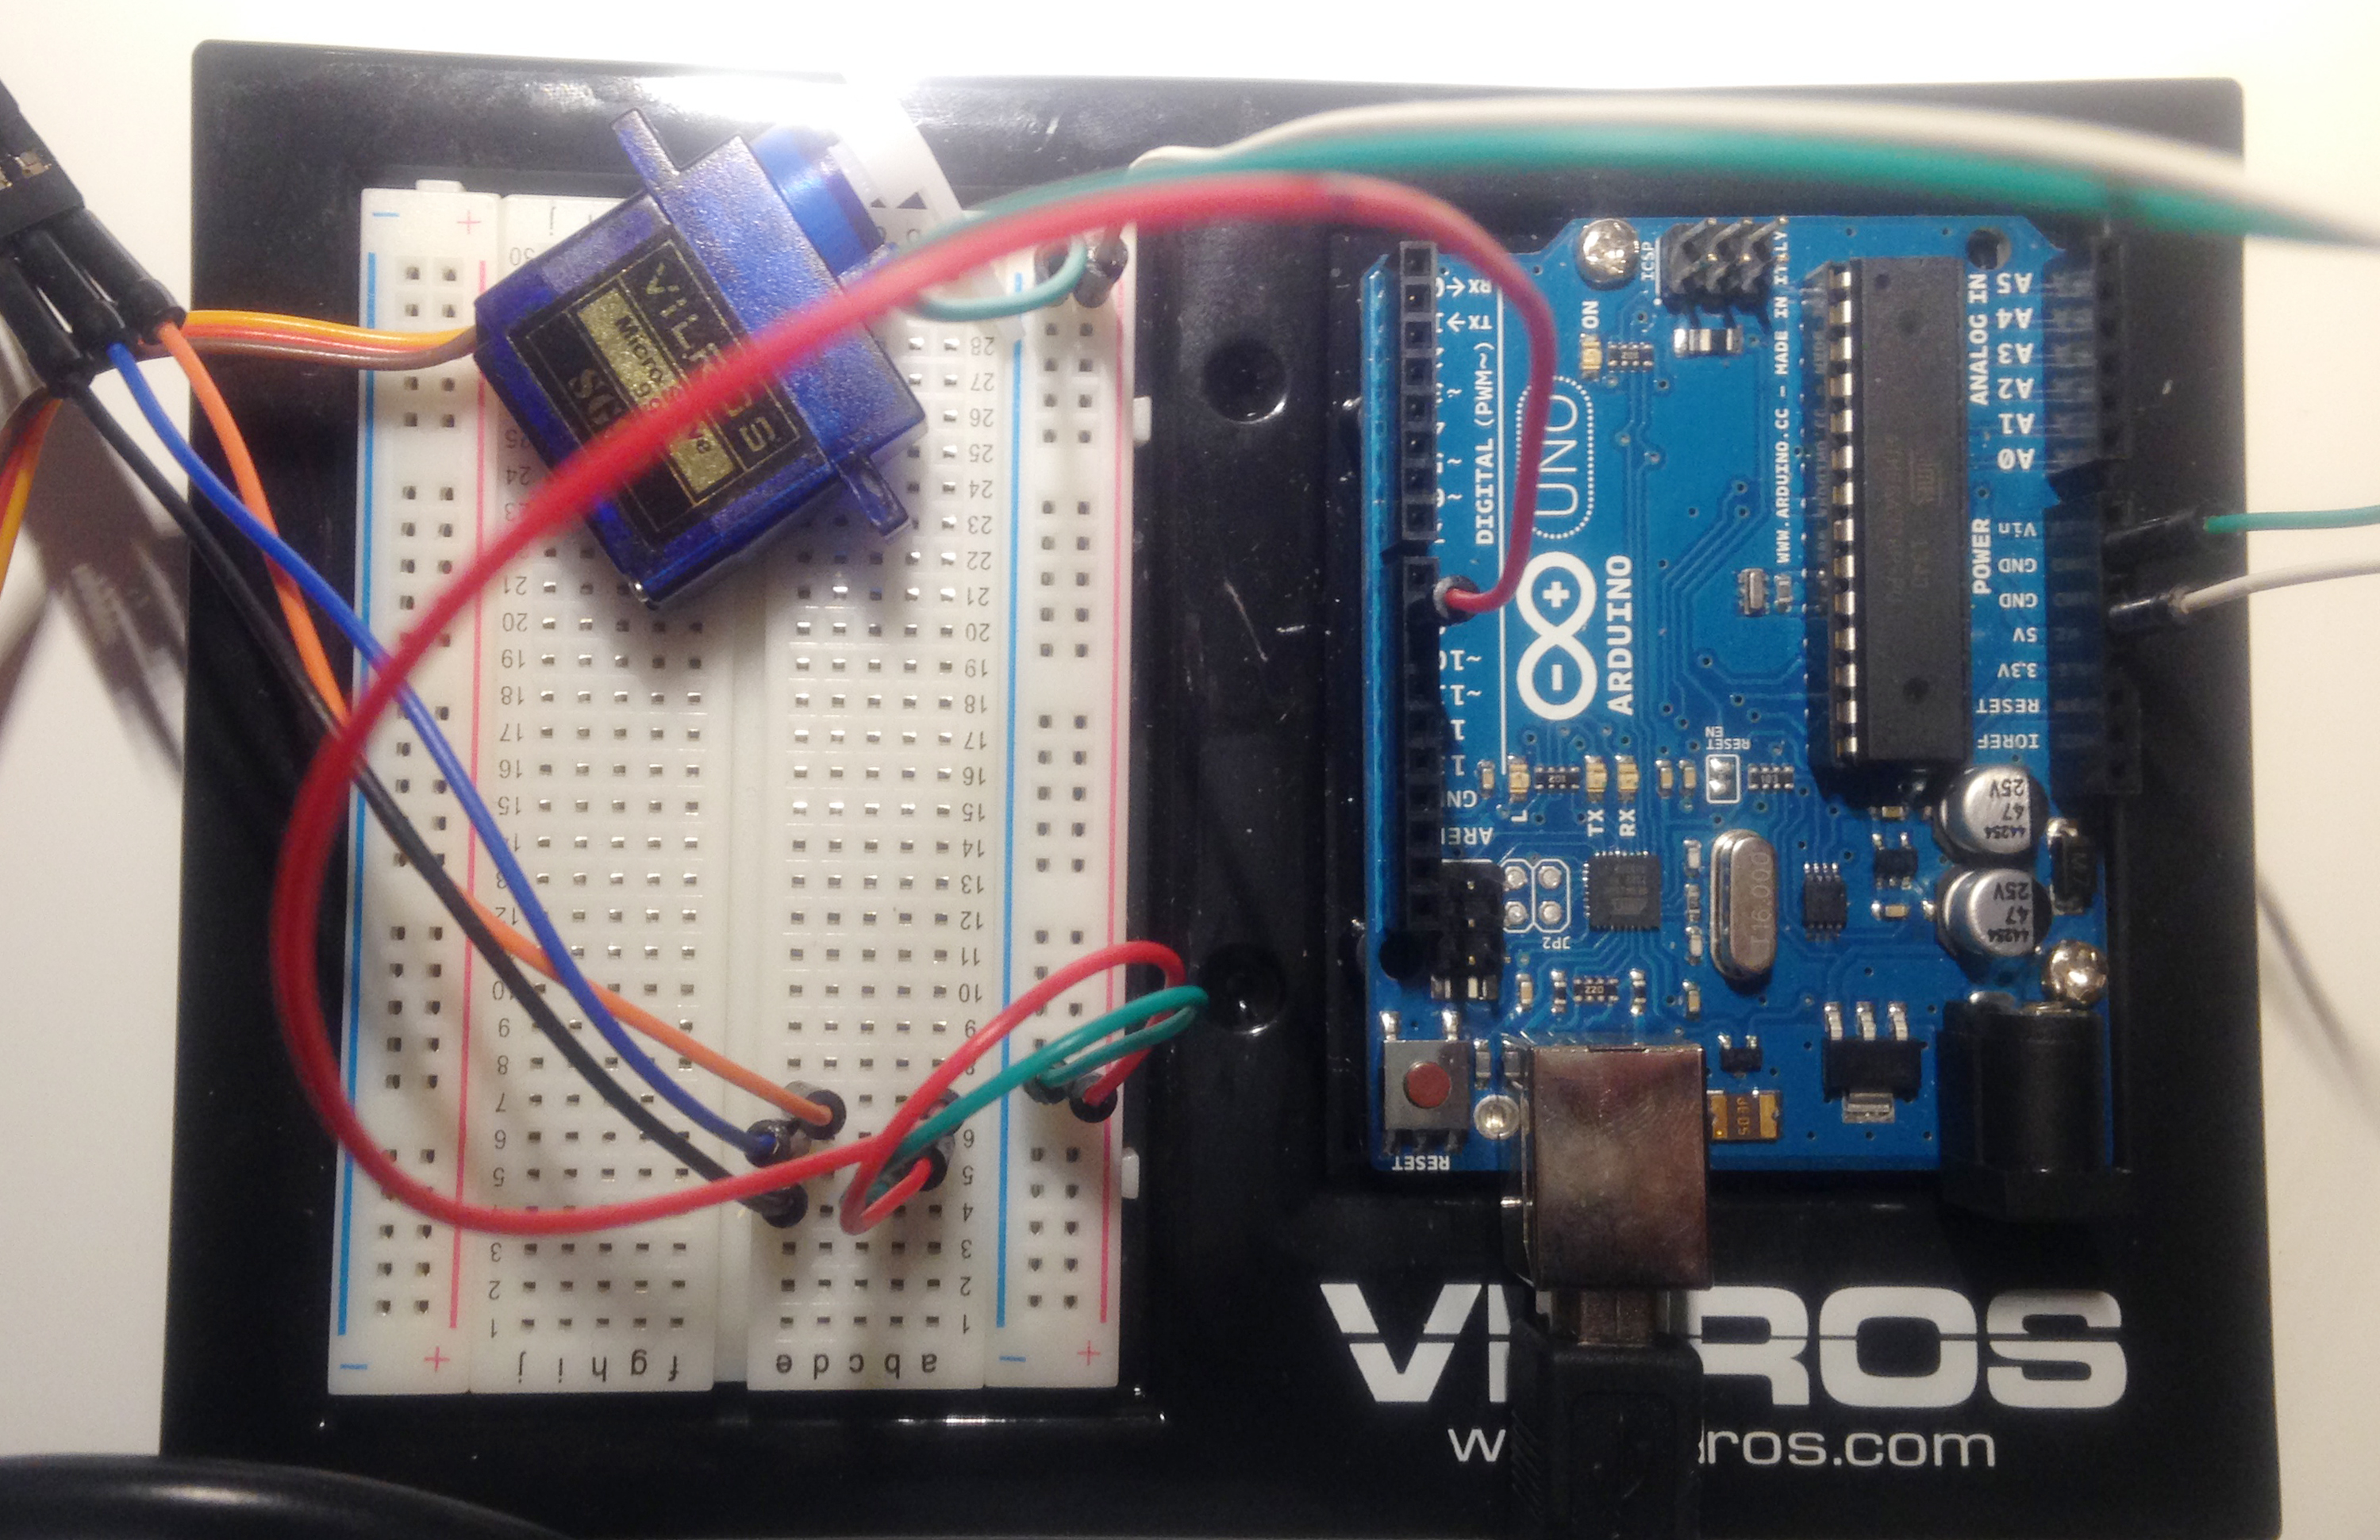
This is what your code should look like when you’re done:
PROCESSING CODE
1
2
3
4
5
6
7
8
9
10
11
12
13
14
15
16
17
18
19
20
21
22
23
24
25
26
27
28
29
30
31
32
33
34
35
36
37
38
39
40
41
42
43
44
45
46
47
48
49
50
51
52
53
//The following code was written with the reference of the online links and example files mentioned below.
Wave movement in processing We want to simulate a wave movement based on the up-and-down of a grid of balls. I have imagined of two kinds of ways that we can interact with our wave grid: -Point based control: The wave is simulated starting from a point, and moves towards all directions from that very point. We will gonna control the position of the point that affects the grid, by mouse position, or Leap Motion gesture position. -Line based control: The wave grid is affected by a line, and moves in the vertical direction of the line. The line is adjusted by our mouse position or Leap Motion gesture position.
The grid of balls
We will write a class for the grid. They are the basic class that we will simulate the movement of grid. I have used IGeo Vector library here.
1
2
3
4
5
6
7
8
9
10
11
12
13
14
15
16
17
18
19
20
21
22
23
24
25
26
27
28
29
30
31
32
33
34
35
36
37
38
39
40
41
42
43
44
45
46
47
48
49
50
51
52
53
54
55
56
57
58
59
60
61
62
63
64
//import the Igeo library which we will use its vector class
import igeo.IVec2;
import igeo.IVec;
//clarify a class named grid
classgrid{
//clarify a vector called v, which represents the position of this grid node
IVecv;
grid(){
}
//the construction function of grid
grid(IVecv){
this.v=v;
}
//another construction function of grid
grid(doublex,doubley,doublez){
this.v=newIVec(x,y,z);
}
//the function to change the z position of the grid node
For this point field, it is capable of calculating the distance to each ball in the grid, and thus change the position based on the distance, through the calculation of the cos value based on the distance, the wave distance, the phase, and the circulation.
Control the grid by Line
Here I will write a class that functions as a line field that can affect the position of the grid. It is based on a line2d class that can help me do some geometry calculation.
1
2
3
4
5
6
7
8
9
10
11
12
13
14
15
16
17
18
19
20
21
22
23
24
25
26
27
28
29
30
31
32
33
34
35
36
37
38
39
40
41
42
43
44
45
46
47
48
49
50
51
52
53
54
55
56
57
58
59
60
61
62
63
64
65
66
67
68
69
70
71
72
73
74
75
76
77
78
79
80
81
82
83
84
85
86
87
88
89
90
91
92
93
94
95
96
97
98
99
100
101
102
103
104
105
106
107
108
109
110
111
112
113
114
115
116
117
118
119
120
import processing.core.PApplet;
import igeo.IVec2;
classLine2d{
doubleA,B,C;
IVec2a,b;
Line2d(){
}
Line2d(IVec2a,IVec2b){
this.a=a;
this.b=b;
this.A=a.y-b.y;
this.B=b.x-a.x;
this.C=a.x *b.y-a.y *b.x;
}
Line2d(doubleA,doubleB,doubleC){
this.A=A;
this.B=B;
this.C=C;
}
IVec2 VerticalPoint(IVec2p){
IVec2v=newIVec2();
doubletmp=A *A+B *B;
v.x=(B *B *p.x-A *B *p.y-A *C)/tmp;
v.y=(A *A *p.y-A *B *p.x-B *C)/tmp;
returnv;
}
booleancontain(IVec2p){
// judge edge contain p. on edge doesn't count as contain
Based on the line class above, I wrote a line wave class which will utilize the functions to affect grid nodes according to the distance to the certain line described in the way of line2d class.
1
2
3
4
5
6
7
8
9
10
11
12
13
14
15
16
17
18
19
20
21
22
23
24
25
26
27
28
29
30
31
32
33
34
35
36
37
38
39
40
41
42
43
44
45
46
47
48
49
50
51
52
53
54
55
56
57
58
59
60
61
62
63
64
65
66
67
68
69
70
71
72
73
74
75
76
77
78
79
80
81
82
83
84
85
86
87
88
89
90
91
92
93
94
95
96
97
98
99
100
101
102
103
104
105
106
107
108
109
110
111
112
113
114
115
116
117
118
119
120
121
122
123
124
import igeo.IVec;
import igeo.IVec2;
classlineWave{
IVec2[]DirList;//awaited direction list
IVec2 dir;//direction of wave movement, line is vertival to that
doubleL=50;//how long the length of a wava is
doublephase=0;//current location
doubleS=100;//how high the wave is
booleancir=false;//is it a one time wave or a circular wave
IVec2 pos;//one point on the line wave
Line2dl;
floatwid,hei;
lineWave(){
//this.l = new Line2d(IVec);
}
lineWave(IVec2 pos,intdir,doubles){
//this.l = new Line2d(IVec);
DirList=newIVec2[8];
DirList[0]=newIVec2(0,-1);
DirList[1]=newIVec2(0,1);
DirList[2]=newIVec2(-1,0);
DirList[3]=newIVec2(1,0);
DirList[4]=newIVec2(-1,1);
DirList[5]=newIVec2(-1,-1);
DirList[6]=newIVec2(1,-1);
DirList[7]=newIVec2(1,1);
this.dir=this.DirList[dir];
this.S=s;
this.pos=pos;
IVec2 lv=this.dir.dup().rot(Math.PI/2);
IVec2 vv=this.pos.dup().add(lv);
this.l=newLine2d(this.pos,vv);
}
doublezLocation(IVec2v){
IVec2 vv=this.l.VerticalPoint(v);
doubledis=vv.dist(v);
returnMath.cos(dis/this.L-this.phase)*this.S;
}
voidresetPos(doublex,doubley){
this.pos.x=x;
this.pos.y=y;
IVec2 lv=this.dir.dup().rot(Math.PI/2);
IVec2 vv=this.pos.dup().add(lv);
this.l=newLine2d(this.pos,vv);
}
voidsetWH(floatwid2,floathei){
this.wid=wid2;
this.hei=hei;
}
voidresetDir(IVec2 vv){
IVec2 dd=newIVec2();
doubleangle=Double.MAX_VALUE;
intcount=0;
for(inti=0;i<this.DirList.length;i++){
if(DirList[i].angle(vv)<angle){
angle=DirList[i].angle(vv);
dd=DirList[i];
count=i;
}
}
if(count==0)this.pos=newIVec2(wid/2,0);
elseif(count==1)this.pos=newIVec2(wid/2,hei);
elseif(count==2)this.pos=newIVec2(0,hei/2);
elseif(count==3)this.pos=newIVec2(wid,hei/2);
elseif(count==4)this.pos=newIVec2(0,hei);
elseif(count==5)this.pos=newIVec2(0,0);
elseif(count==6)this.pos=newIVec2(wid,0);
elsethis.pos=newIVec2(wid,hei);
println(this.pos);
this.dir=dd;
IVec2 lv=this.dir.dup().rot(Math.PI/2);
IVec2 vvv=this.pos.dup().add(lv);
this.l=newLine2d(this.pos,vvv);
}
voidtime(doublei){
this.phase+=i;
}
voidaffect(grid[][]gs){
for(grid[]gg:gs){
for(gridg:gg){
g.setZ(this.zLocation(g.location2d()));
}
}
}
voiddraw(PApplet app){
pushStyle();
//line(x1, y1, x2, y2);
this.l.draw(app);
ellipse((float)pos.x,(float)pos.y,10,10);
popStyle();
}
}
The Main function of the point control simulation software
We need this main function that will utilize the class of grid and pointwave that we wrote, thus to finalize the simulate of the behavior of the wave movement based on our control of that point. We will start with the mouse control, which is a function built in processing, and later on we will use the Leap Motion control to replace the mouse Position here. In order to show 3D perspective in a more controled way, I have used a 3D camera library called peasy camera here.
1
2
3
4
5
6
7
8
9
10
11
12
13
14
15
16
17
18
19
20
21
22
23
24
25
26
27
28
29
30
31
32
33
34
35
36
37
38
39
40
41
42
43
44
45
46
47
48
49
50
51
52
53
54
55
56
57
58
import needed library forvector and3dcamera
import igeo.*;
import peasy.*;
PeasyCam cam;//initiate the camera
floatwid=500;//width of screen
floathei=500;//height of screen
intwnum=5;//width number of grid node
inthnum=5;//height number of grid node
grid[][]gs;//to the grid node matrix we are gonna simulate
ptWave pt;//the control point
voidsetup(){
size((int)wid,(int)hei,P3D);
//these are to initiate the camera
cam=newPeasyCam(this,1000);
cam.lookAt((int)wid/2,(int)hei/2,0);
cam.setMinimumDistance(50);
cam.setMaximumDistance(500000);
cam.setRotations(100,0,0);
//initiate the control point
pt=newptWave();
//initiate the grids
gs=newgrid[wnum][hnum];
for(inti=0;i<wnum;i++){
for(intj=0;j<hnum;j++){
gs[i][j]=newgrid(wid/wnum*i,hei/hnum*j,0);
}
}
}
voiddraw(){
//reset the position of the control point to mouse position
pt.setLocation(mouseX,mouseY);
//time goes by, wave moves accordingly
pt.time(0.1f);
//the control point works on the consition of the grid nodes
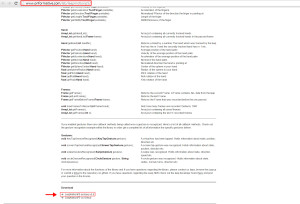
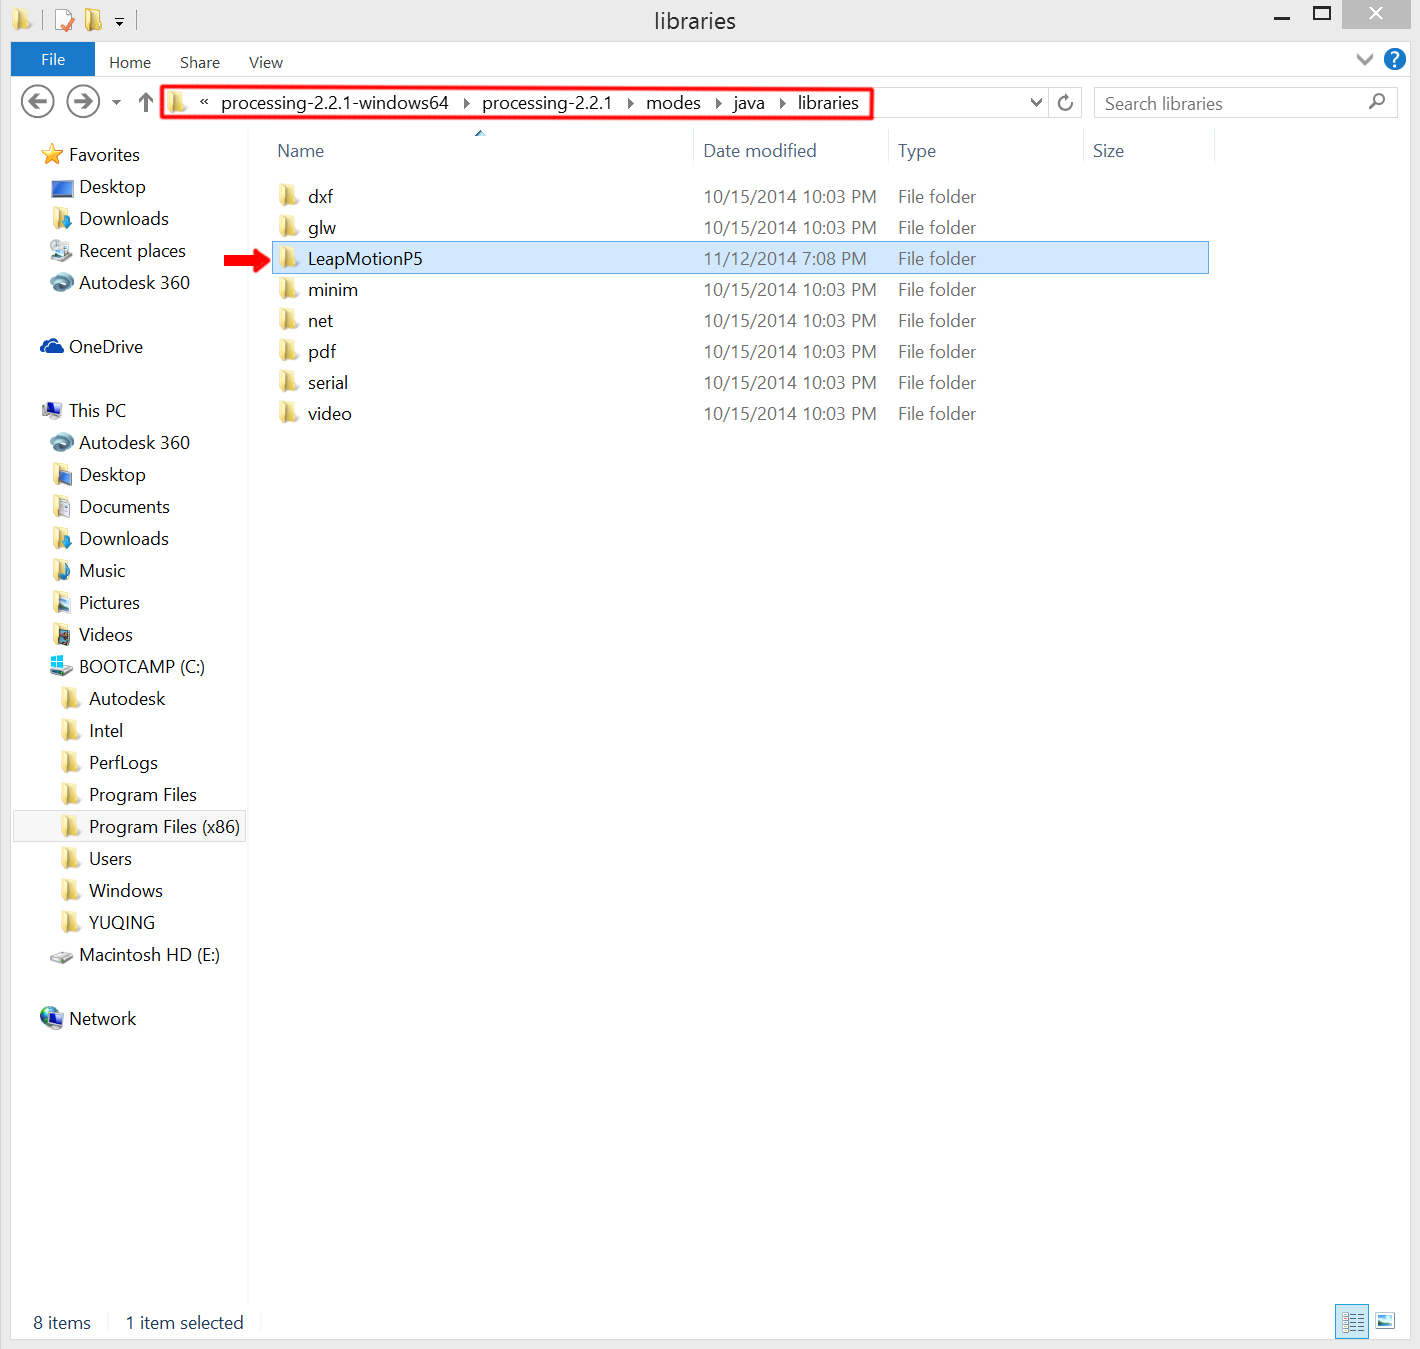
In this tutorial, you will be able to use Leap Motion sensor to create vectors. This tutorial shows capability to our “Wind [Motion] Chime” setup which is use Leap Motion to control the Wind Chime move up and down and make sounds.
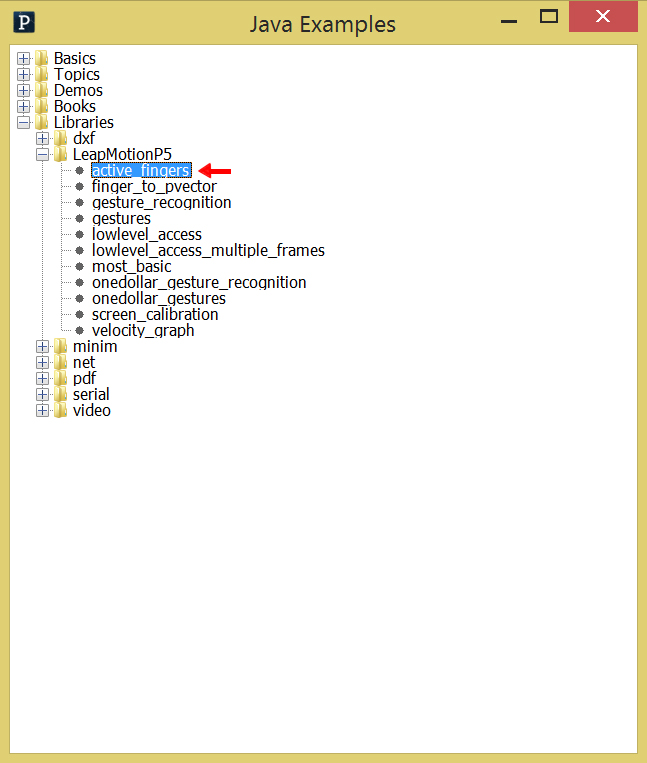
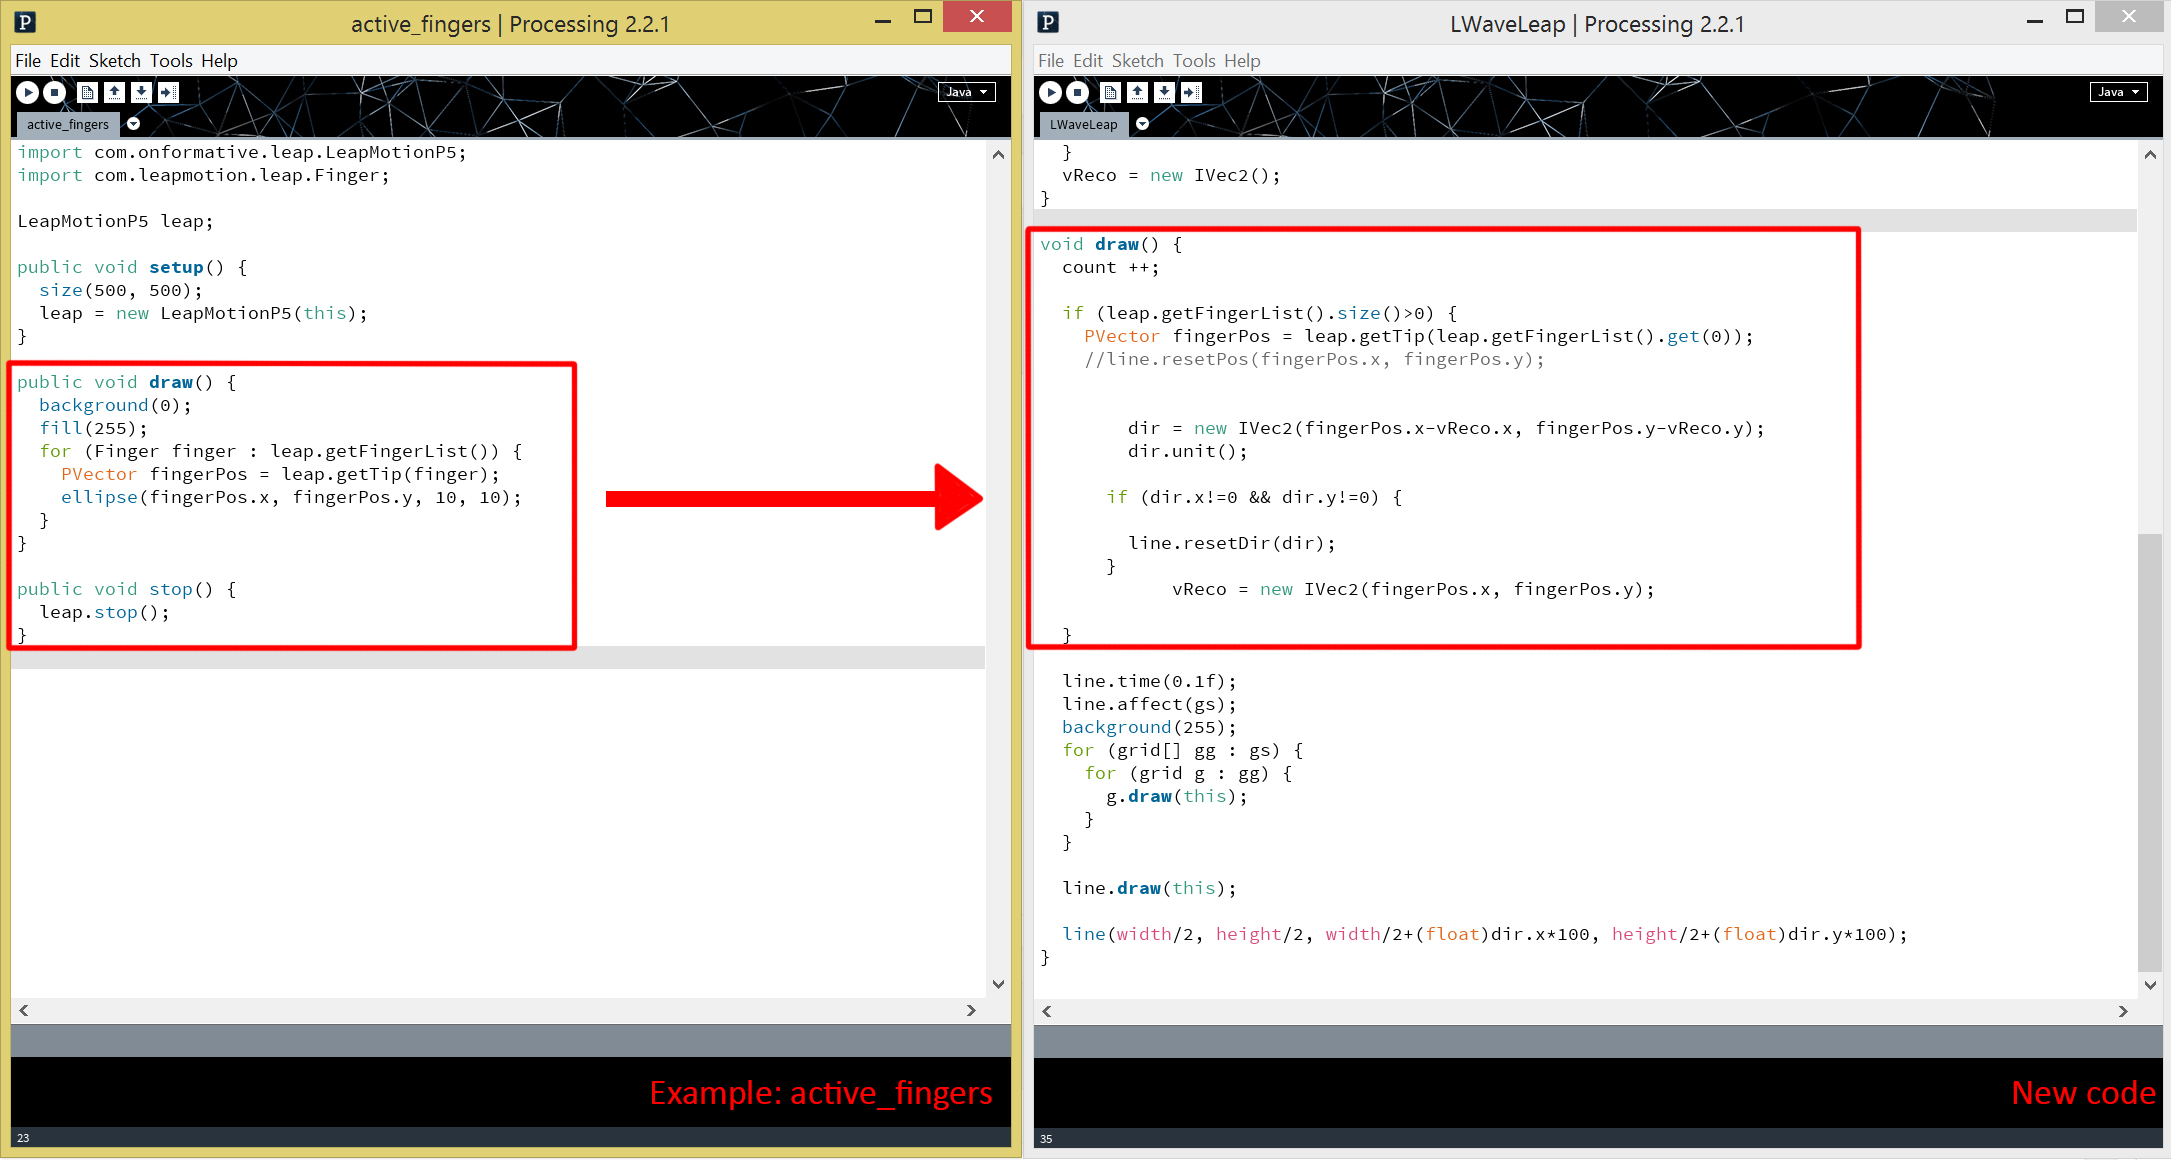
Go to the “File” menu –> Examples drop down, you should be able to see the names of the new library that you’ve just installed. Find out “active_fingers”, and open up.
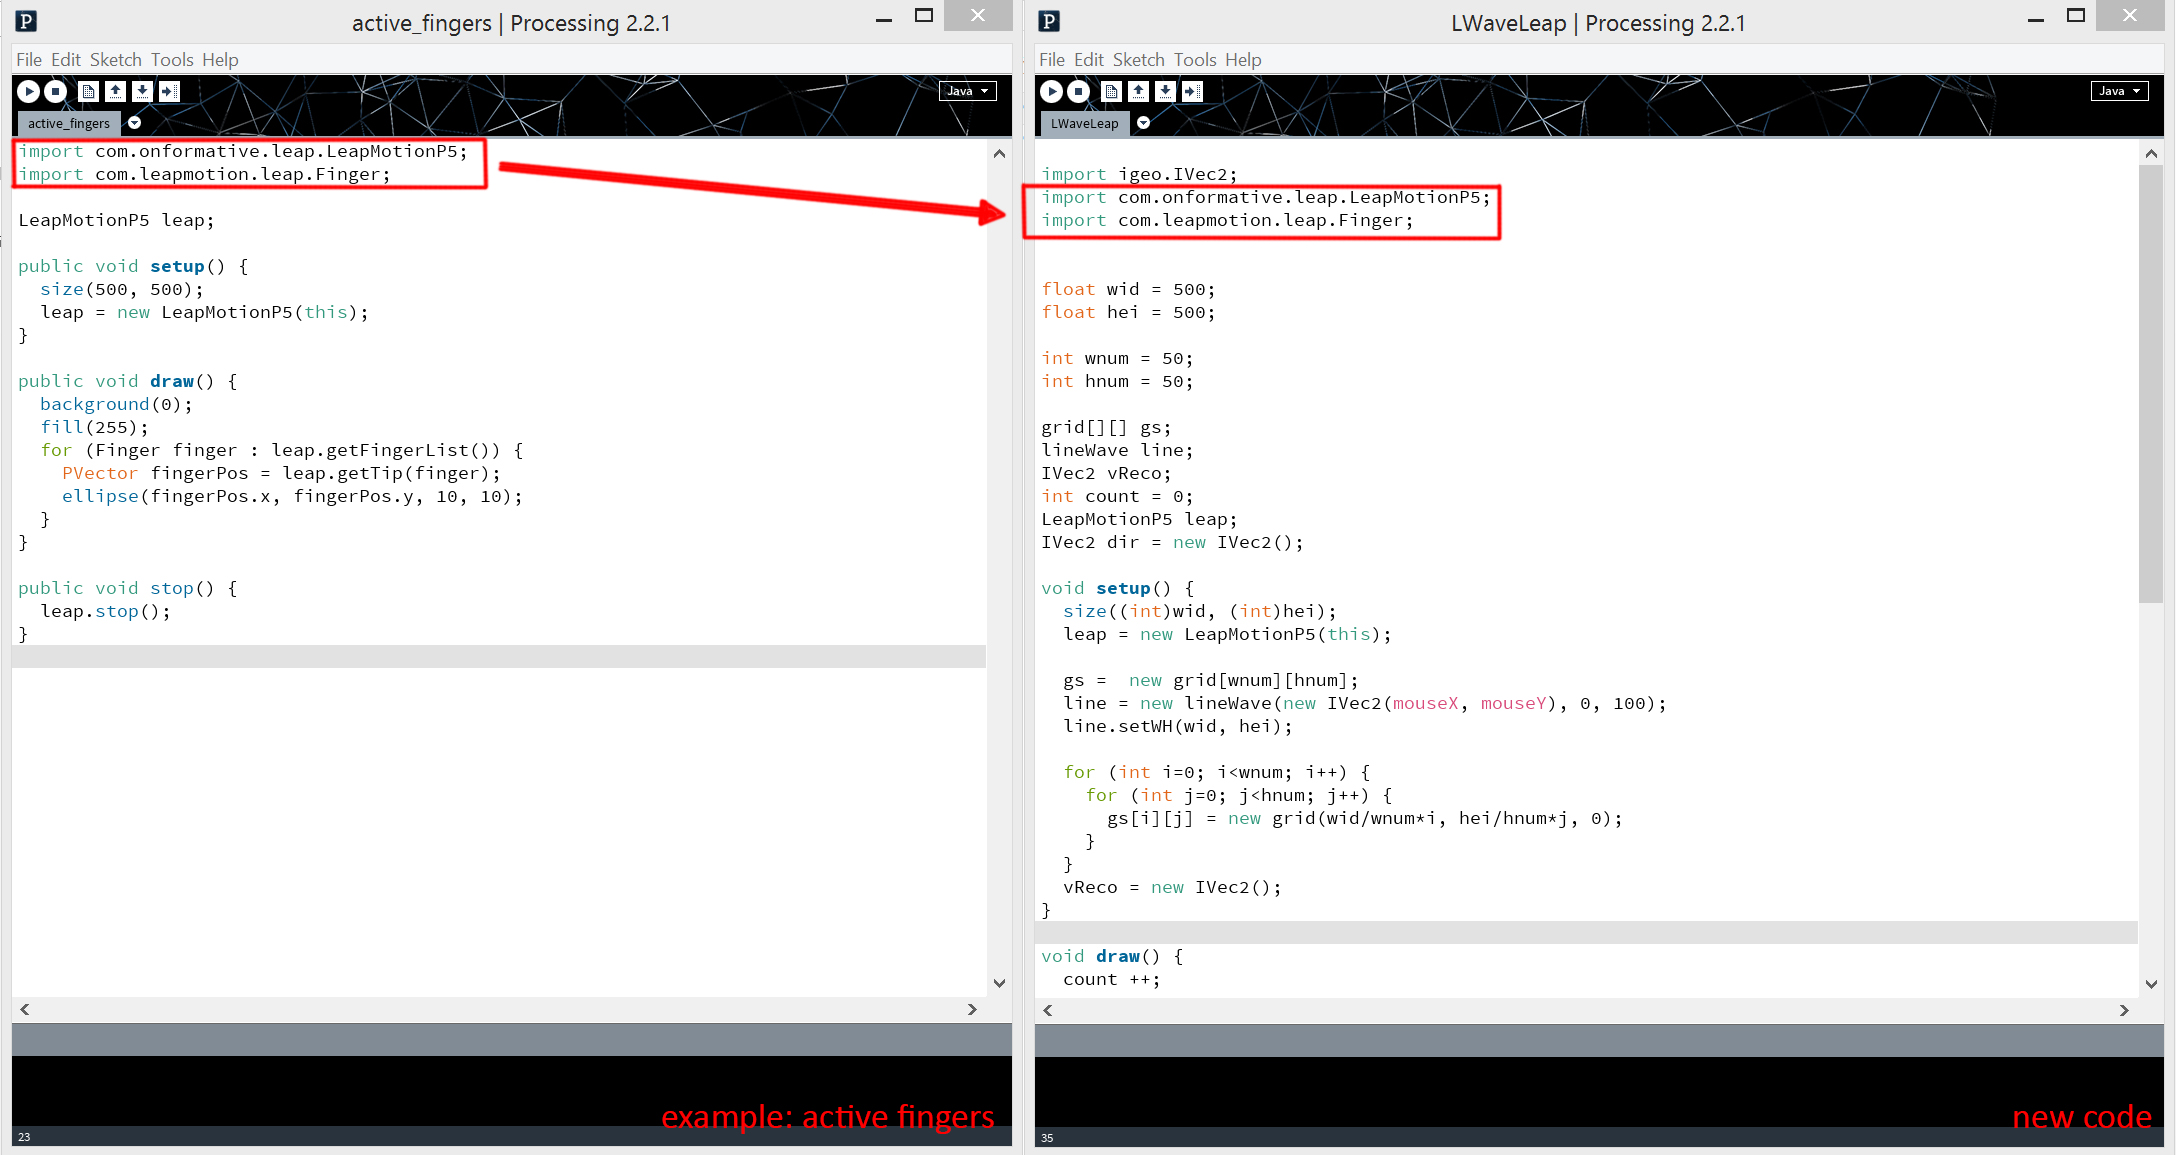
Copy the code
“import com.onformative.leap.LeapMotionP5;”
“import com.leapmotion.leap.Finger;”
to the very front of the new sketch
In the “active_fingers” example, Leap Motion could sense 5 fingers’ movement and draw ellipse.
In the new processing code, we use Leap Motion to create vectors.
Wall adaptor power supply 9 volts (or other power source that can provide between 7 and 24 volts)
Hooking it up
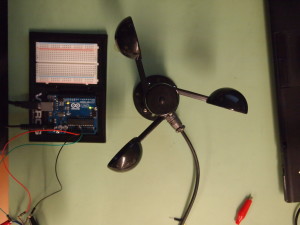
The anemometer connects to the rest of the circuits through a single waterproof cable that bundles three wires. These three wires stick out of the end of the cable, each a different color: brown, black, and blue. The brown wire should be connected to the positive power source. The black should be connected to ground, and the blue is the output for the anemometer.
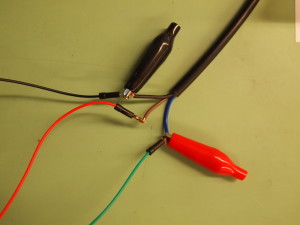
To more easily connect to the Arduino, wrap each wire from the anemometer around the male terminal of a jumper wire. Secure with an alligator clip (Figure 1).
Figure 1: Connecting the anemometer wires
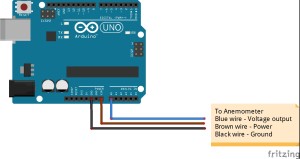
Using the jumper wire, connect the brown wire to the Vin pin (called 9V on some boards). Connect the black wire to one of the ground pins. Connect the blue output wire to one of the analog pins. For this tutorial we used pin A0. Figure 2 shows the circuit diagram for the entire assembly. Figure 3 shows the connections on an actual Arduino Uno.
Figure 2: Arduino attachments for anemometer
Figure 3: Arduino wiring
The anemometer requires a power source between 7V and 24V to produce a measurement. Arduinos use a lower voltage, between 3V and 5V, so the power coming to an Arduino through a USB connection isn’t enough to power the anemometer.
Instead, we’ll use another the external power supply on the board, sometimes labeled X1. This port accepts a female coaxial cable and is appropriate for ranges between 9V and 12V. To use this power source without damaging itself, the Arduino board uses a linear voltage reducer to bring it into the 3V-5V range. However, out anemometer can still access the full voltage if we connect it to the Vin pin (this is why this pin is labeled 9V on some boards).
You can use several sources for the external power supply. One option is to use a standard rectangular 9V battery. However, these batteries are designed for very low current uses for long periods of time (in smoke detectors, for example). The Arduino and anemometer will quickly use up the charge in the battery, leading to fluctuating voltages and bad readings from the sensor. The better option is to buy a wall adapter that produces 9V of steady, higher current power.
Once the wiring is complete and the external power source is connected, the hardware is ready to go. Lets get the software side up and running and measure some wind!
Software
The code for this tutorial takes the voltage output from the anemometer and uses the technical specs from Adafruit to convert the voltage into a wind speed. The anemometer is designed to output voltage between 0.4V and 2V. A value of 0.4V represents no wind and 2V represents a wind speed of 32.4 m/s. The relationship between voltage and wind speed is linear, meaning that each increase of 0.1V represents an increase of 2.025 m/s in wind speed. The following code maps the output values from the anemometer to wind speed using these values.
The Script
1
2
3
4
5
6
7
8
9
10
11
12
13
14
15
16
17
18
19
20
21
22
23
24
25
26
27
28
29
30
31
32
33
34
35
36
37
38
39
40
41
42
43
44
45
46
47
48
49
50
51
52
53
54
55
56
57
58
59
60
61
62
63
64
65
66
67
/*
Anemometer Tutorial
This code takes the output from an Adafruit anemometer (product ID 1733) and converts it into a wind speed.
The circuit:
Created 11 November 2014
By Joe Burg
Modified 11 November 2014
By Joe Burg
Hardware instructions and background information can be found at: http://www.hackerscapes.com/2014/11/anemometer/
Special thanks to Adafruit forum users shirad and adafruit_support_mike for help in trouble shooting code and hardward, including provided code of their own for comparison and inspiration.
*/
//Setup Variables
constintsensorPin=A0;//Defines the pin that the anemometer output is connected to
intsensorValue=0;//Variable stores the value direct from the analog pin
floatsensorVoltage=0;//Variable that stores the voltage (in Volts) from the anemometer being sent to the analog pin
floatwindSpeed=0;// Wind speed in meters per second (m/s)
floatvoltageConversionConstant=.004882814;//This constant maps the value provided from the analog read function, which ranges from 0 to 1023, to actual voltage, which ranges from 0V to 5V
intsensorDelay=1000;//Delay between sensor readings, measured in milliseconds (ms)
//Anemometer Technical Variables
//The following variables correspond to the anemometer sold by Adafruit, but could be modified to fit other anemometers.
floatvoltageMin=.4;// Mininum output voltage from anemometer in mV.
floatwindSpeedMin=0;// Wind speed in meters/sec corresponding to minimum voltage
floatvoltageMax=2.0;// Maximum output voltage from anemometer in mV.
floatwindSpeedMax=32;// Wind speed in meters/sec corresponding to maximum voltage
voidsetup()
{
Serial.begin(9600);//Start the serial connection
}
voidloop()
{
sensorValue=analogRead(sensorPin);//Get a value between 0 and 1023 from the analog pin connected to the anemometer
sensorVoltage=sensorValue *voltageConversionConstant;//Convert sensor value to actual voltage
//Convert voltage value to wind speed using range of max and min voltages and wind speed for the anemometer
if(sensorVoltage<=voltageMin){
windSpeed=0;//Check if voltage is below minimum value. If so, set wind speed to zero.
}else{
windSpeed=(sensorVoltage-voltageMin)*windSpeedMax/(voltageMax-voltageMin);//For voltages above minimum value, use the linear relationship to calculate wind speed.
}
//Print voltage and windspeed to serial
Serial.print("Voltage: ");
Serial.print(sensorVoltage);
Serial.print("\t");
Serial.print("Wind speed: ");
Serial.println(windSpeed);
delay(sensorDelay);
}
Thanks!
Thanks to the rest of the Particle Wave team for their review of the wiring and code for this tutorial. Special thanks to Adafruit forum users shirad and adafruit_support_mike for help in trouble shooting code and hardward, including provided code of their own for comparison and inspiration.
This tutorial explains how to control a Servo’s angle of rotation in relation to a coordinate that can be found in a typical grid of points. You will need a(n):
Arduino Uno
Breadboard
Servo (that can rotate 360 degrees)
6 Wires
Setting It Up
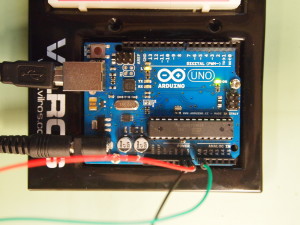
Before we begin to put the parts together, make sure your Arduino board is not connected to your computer!
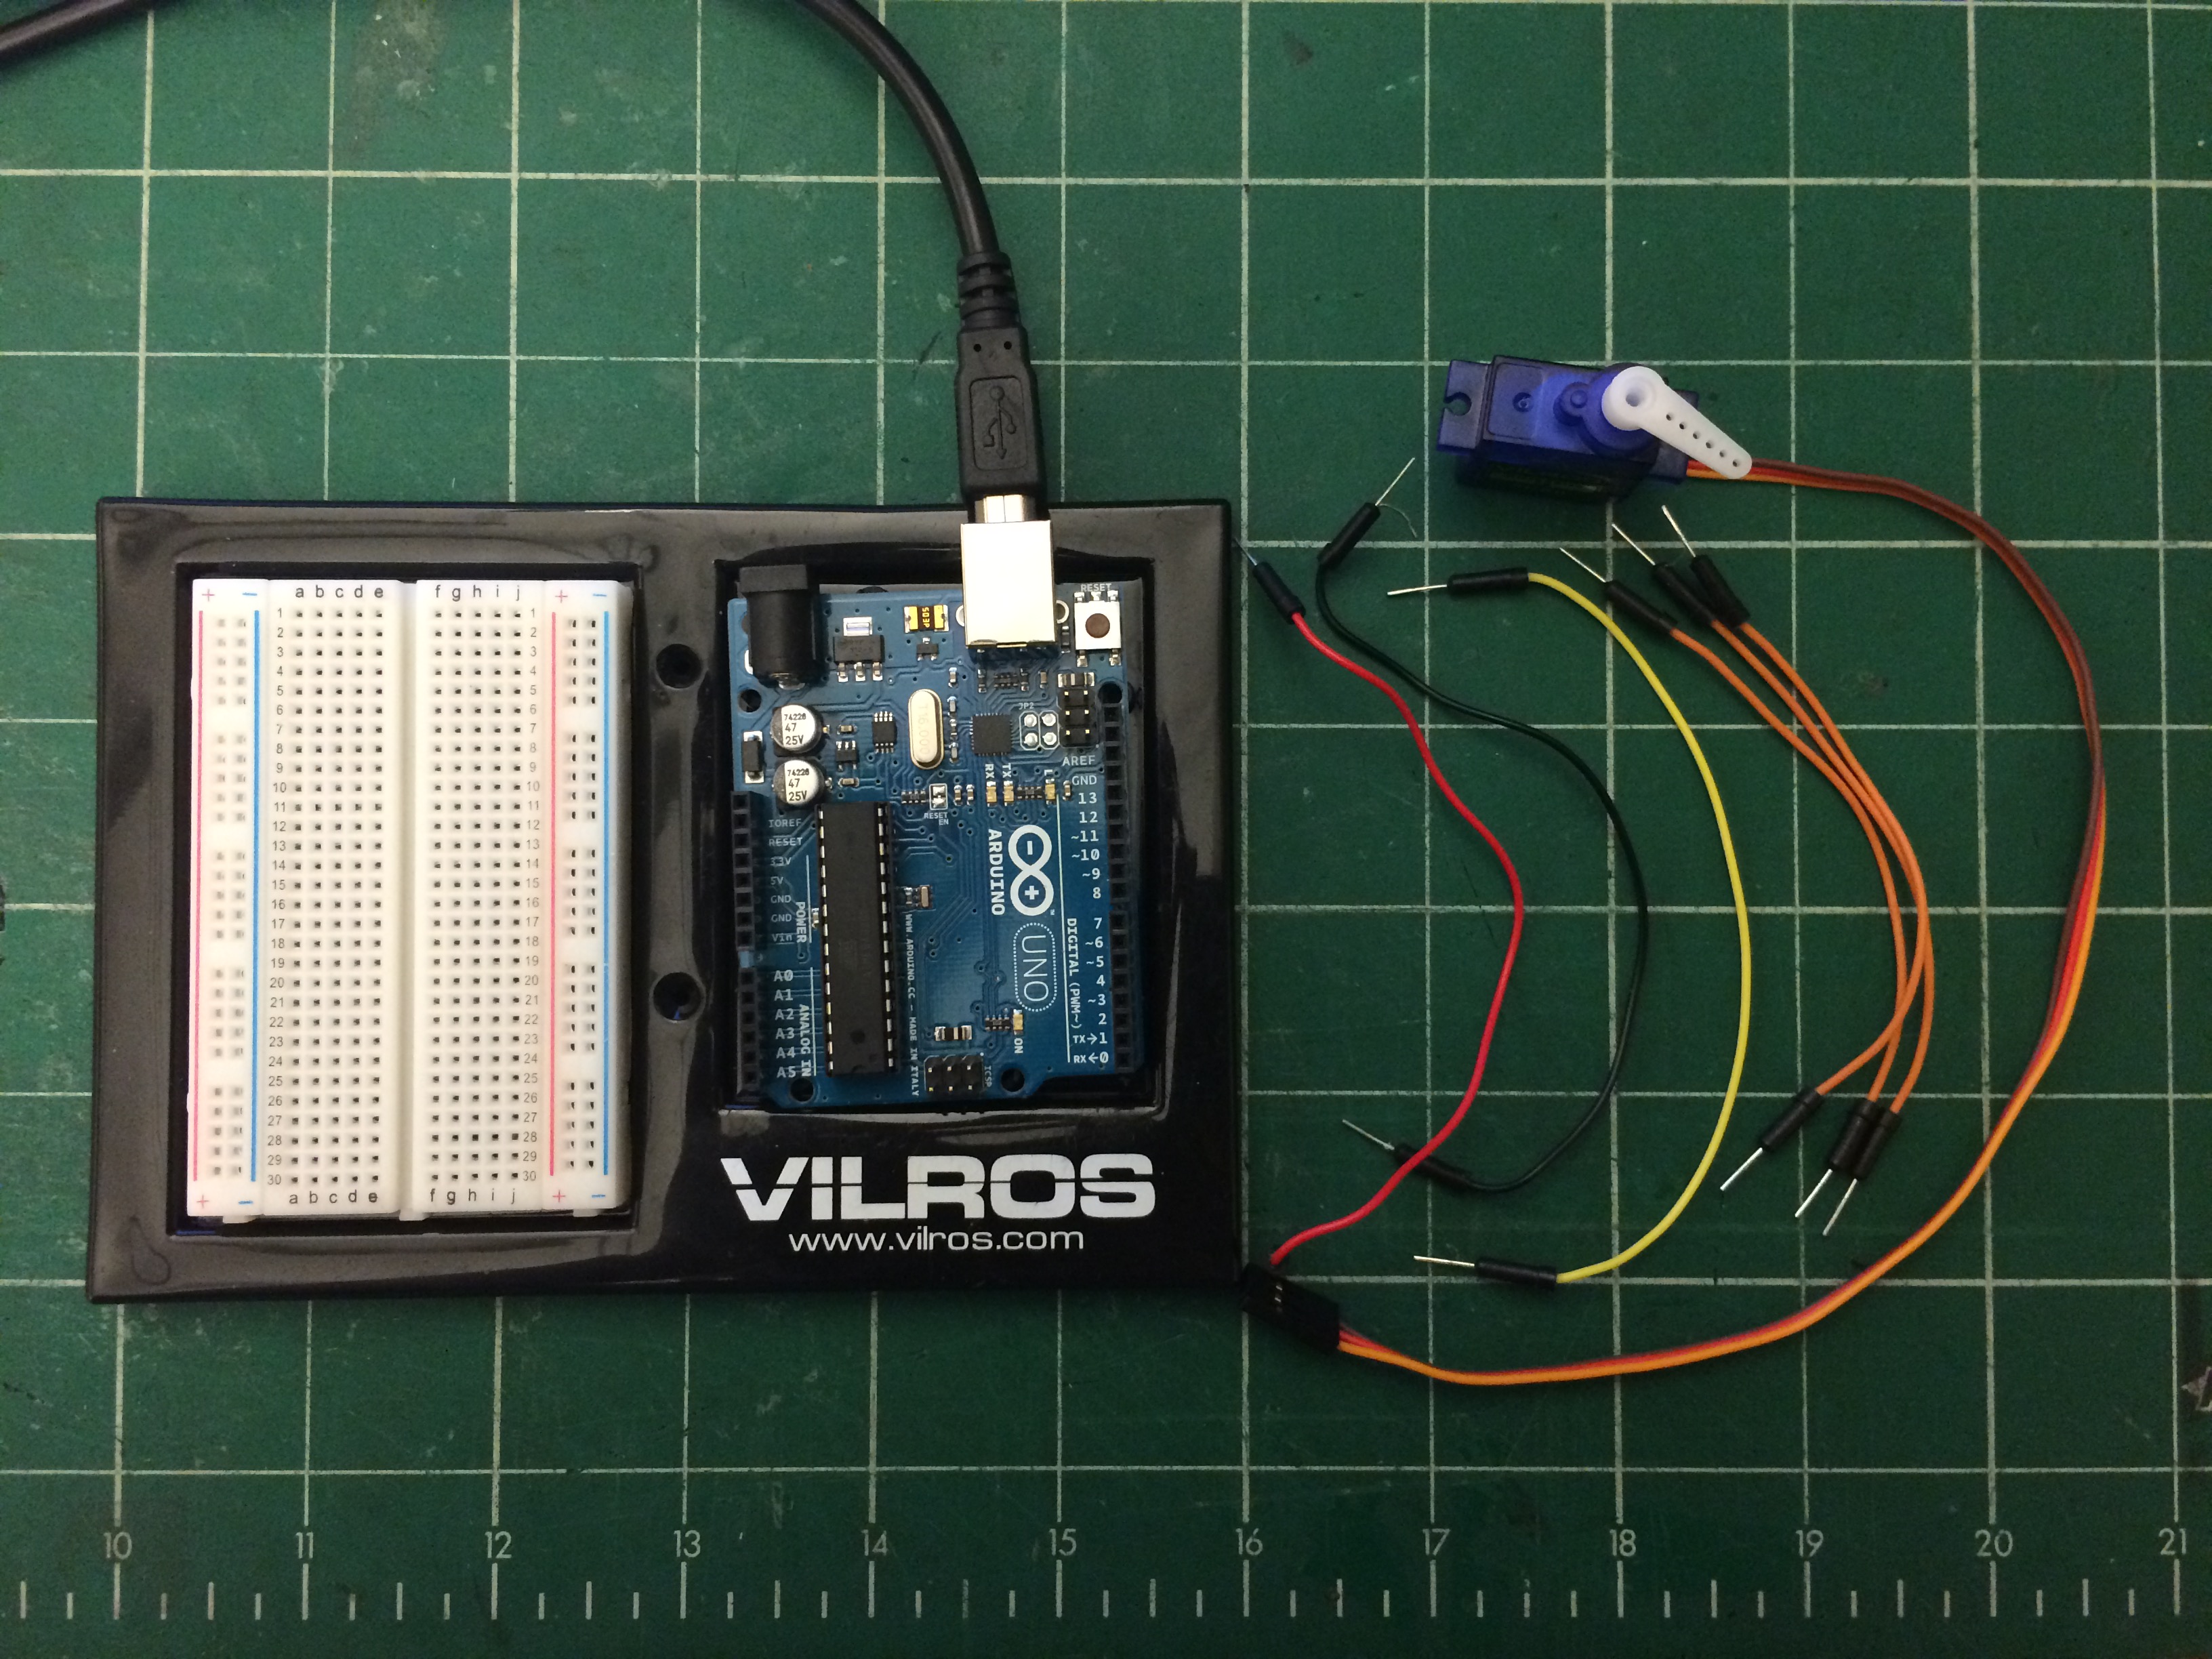
First and foremost, the Servo needs to be connected to a proper source of power for it to work. Make sure to plug in a red wire from the 5V pin to the positive end of the breadboard and to ground it by plugging a black wire from the GND pin to the negative end of the breadboard.
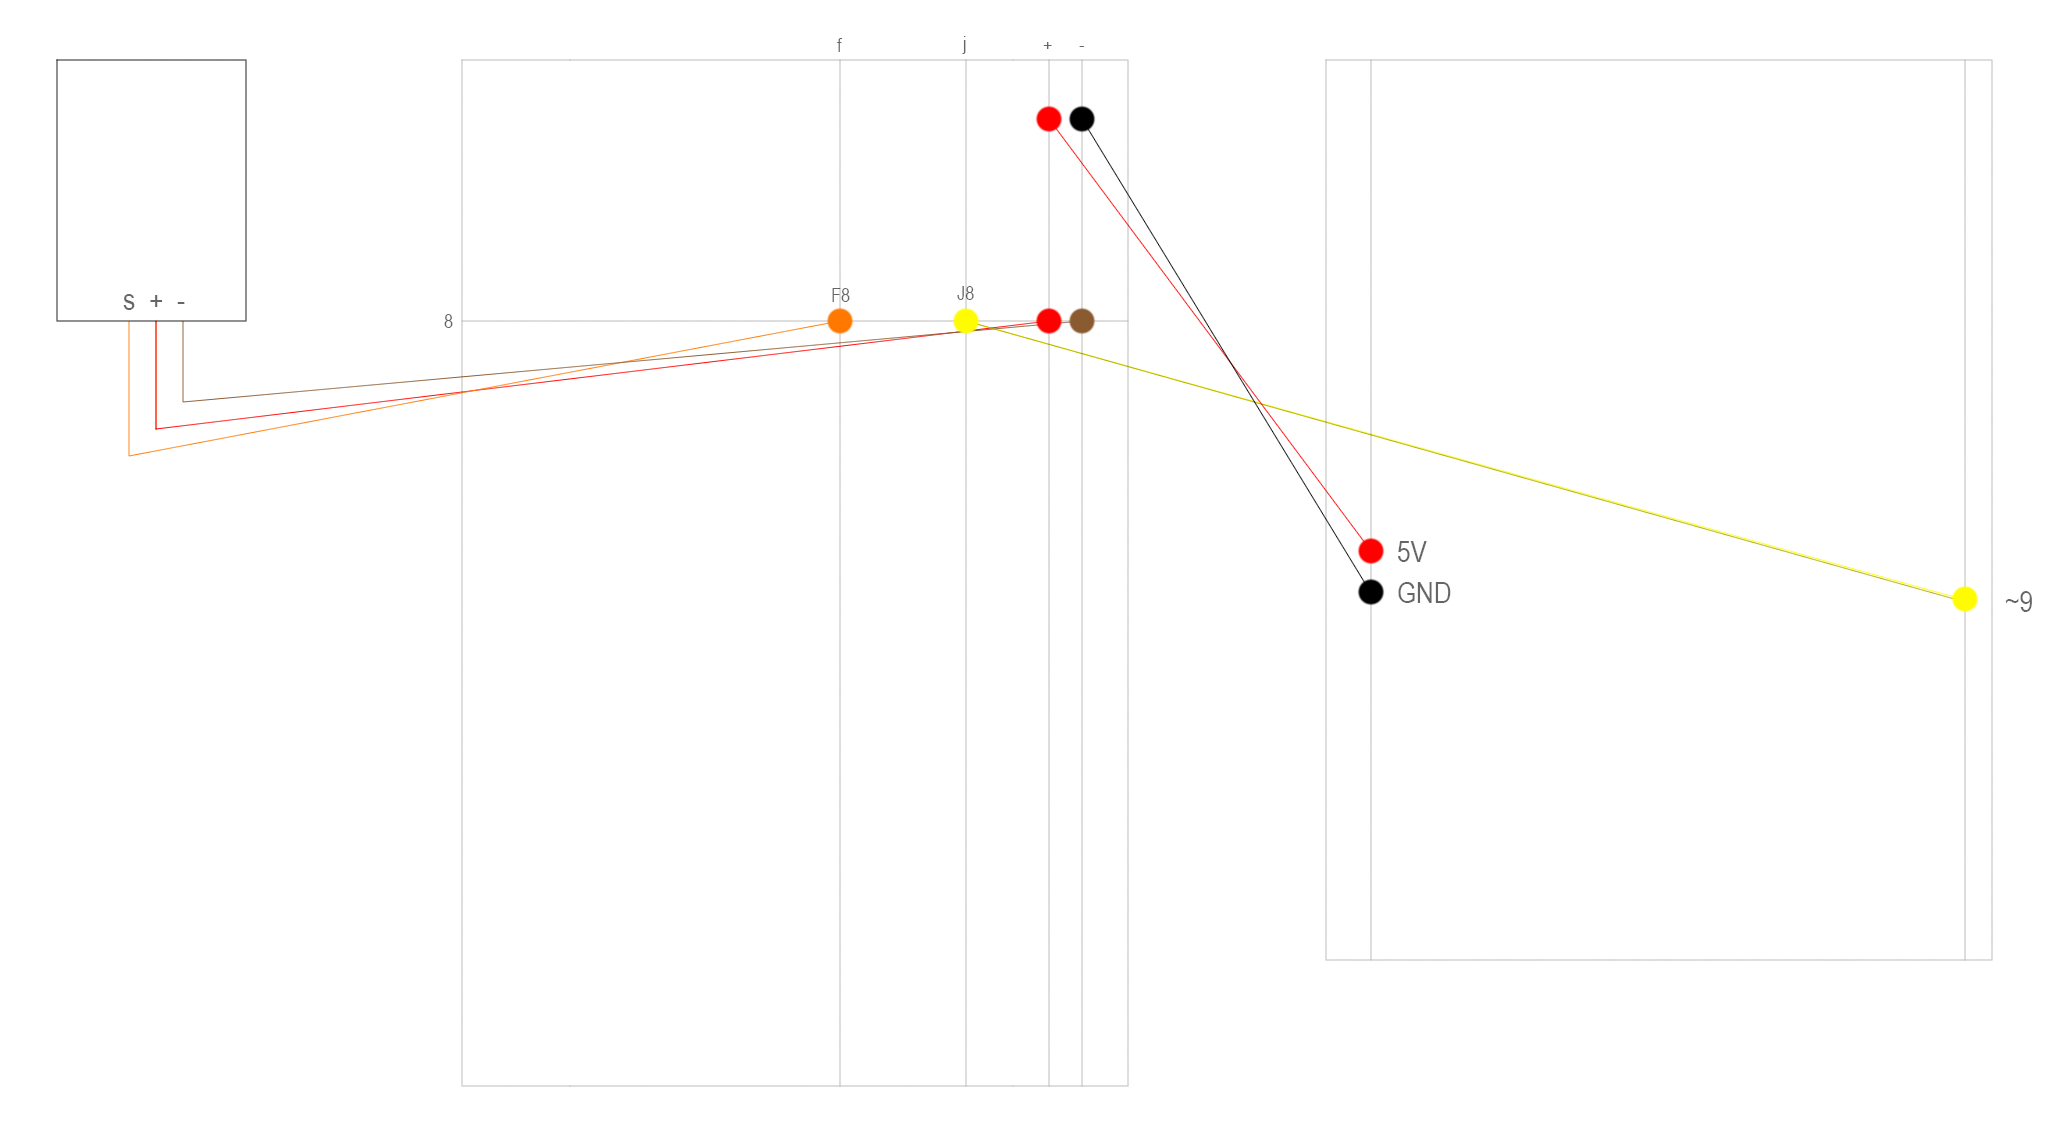
Then, connect your Servo to your breadboard with 3 jumper wires: orange wire (signal) to F8 (breadboard), red wire (+5V) to positive end of breadboard, and brown wire (ground) to negative end of breadboard.
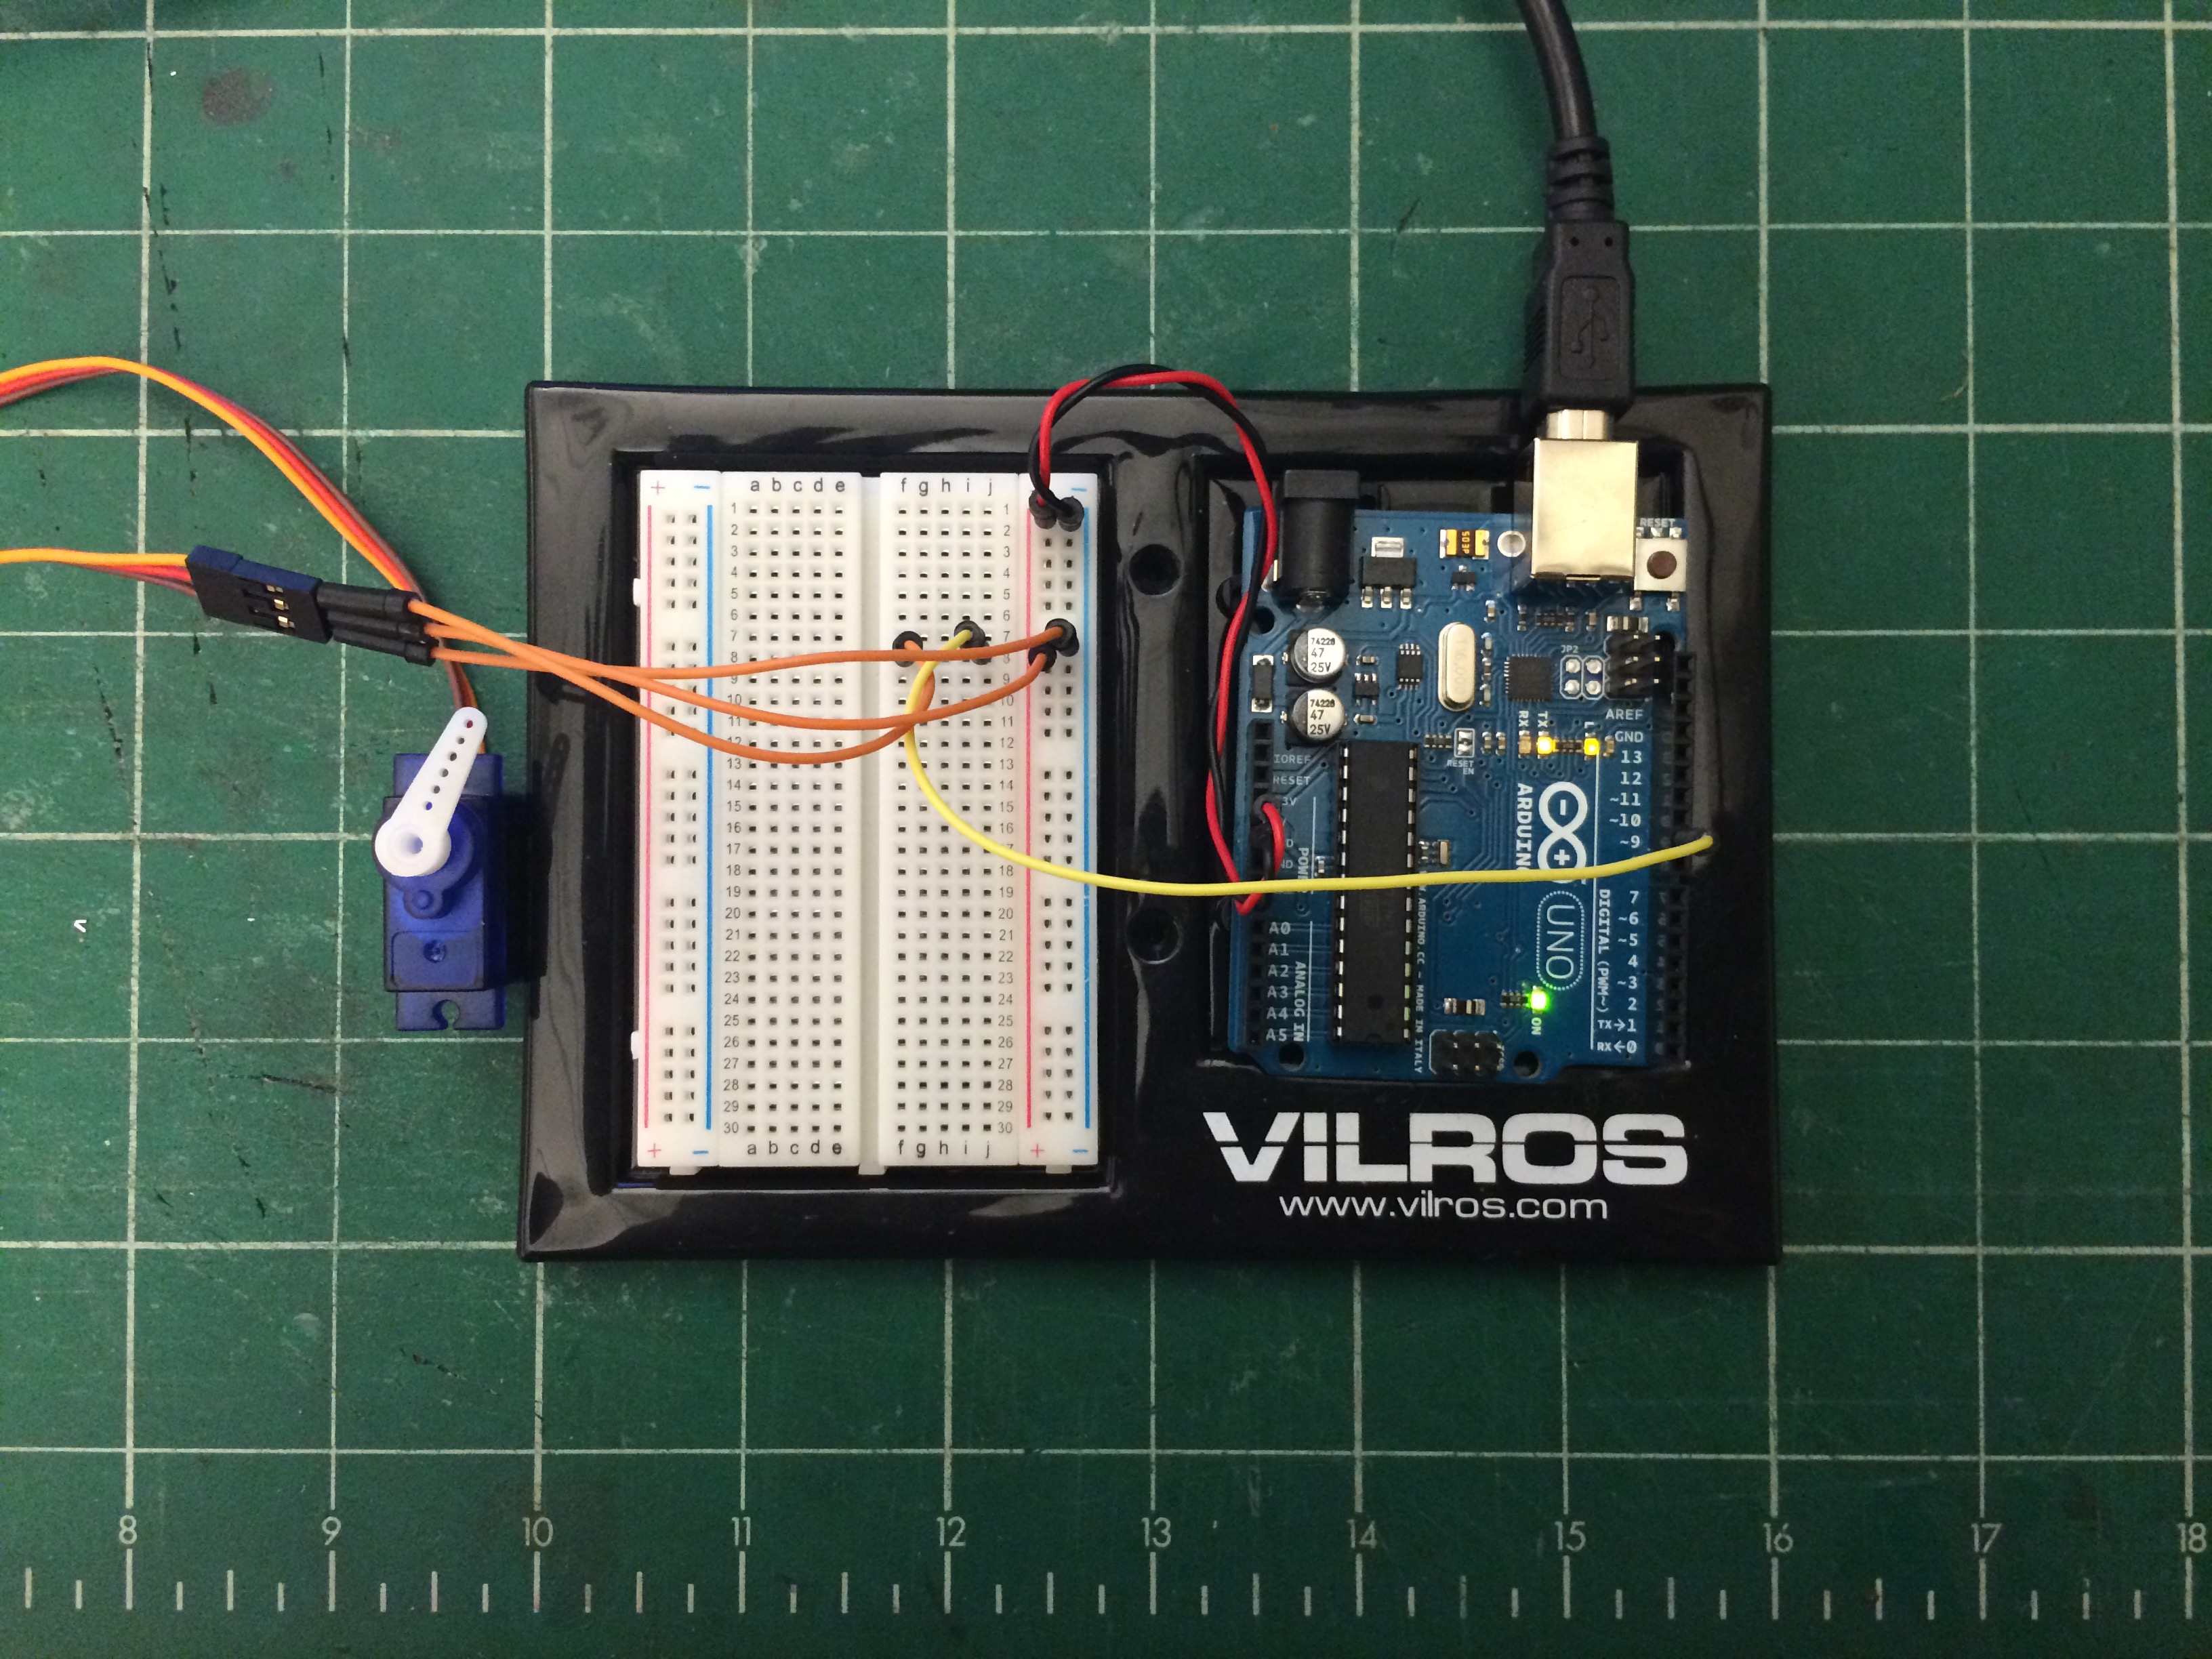
On the same row as the Servo’s orange wire, connect a yellow wire from J8 (breadboard) to pin 9 (Arduino board).
In the end, it should look like this:
Now, let’s make that Servo rotate!
Arduino Code
You will need to open up the Arduino interface before we can start writing some code. Remember, your Arduino board is not connected to the computer, so uploading anything is completely impossible. For your Arduino board’s safety, let’s keep it unplugged for now.
Firstly, you must include two different sets of libraries: (1) Servo.h and (2) math.h. These two libraries provide you with the ability to use your Servo and to use the inverse tangent function. Unfortunately, “pi” is not defined in either libraries, including “math.h”, so you must define it yourself.
1
2
3
4
5
6
7
8
9
10
11
12
13
14
15
16
17
18
19
20
21
22
23
24
25
26
27
28
29
30
// Insert two libraries: Servo.h (for your Servo to work) and math.h (for inverse tangent function).
#include
#include
// Name your servo. I called mine: servo.
Servo servo;
// Since "pi" has not been defined in any of the available libraries, you must define it yourself.
constfloatpi=3.14159265359;
// Set up some floats: (1) PersonX and PersonY (position of person in relation to a coordinate system),
// (2) MotorX and MotorY (position of motor in relation to such coordinate system),
// (3) deltaX and deltaY (difference between the position of person in relationship to the position of the motor,
// and (4) angleRad and angleDeg (angle of motor to person in both radians and degrees).
floatPersonX,PersonY;
floatMotorX,MotorY;
floatdeltaX,deltaY;
floatangleRad,angleDeg;
// In void setup(), make sure to set up a baudrate for your serial monitor
// and to mention what pin your Servo is attached to.
voidsetup(){
Serial.begin(9600);
servo.attach(9);
}
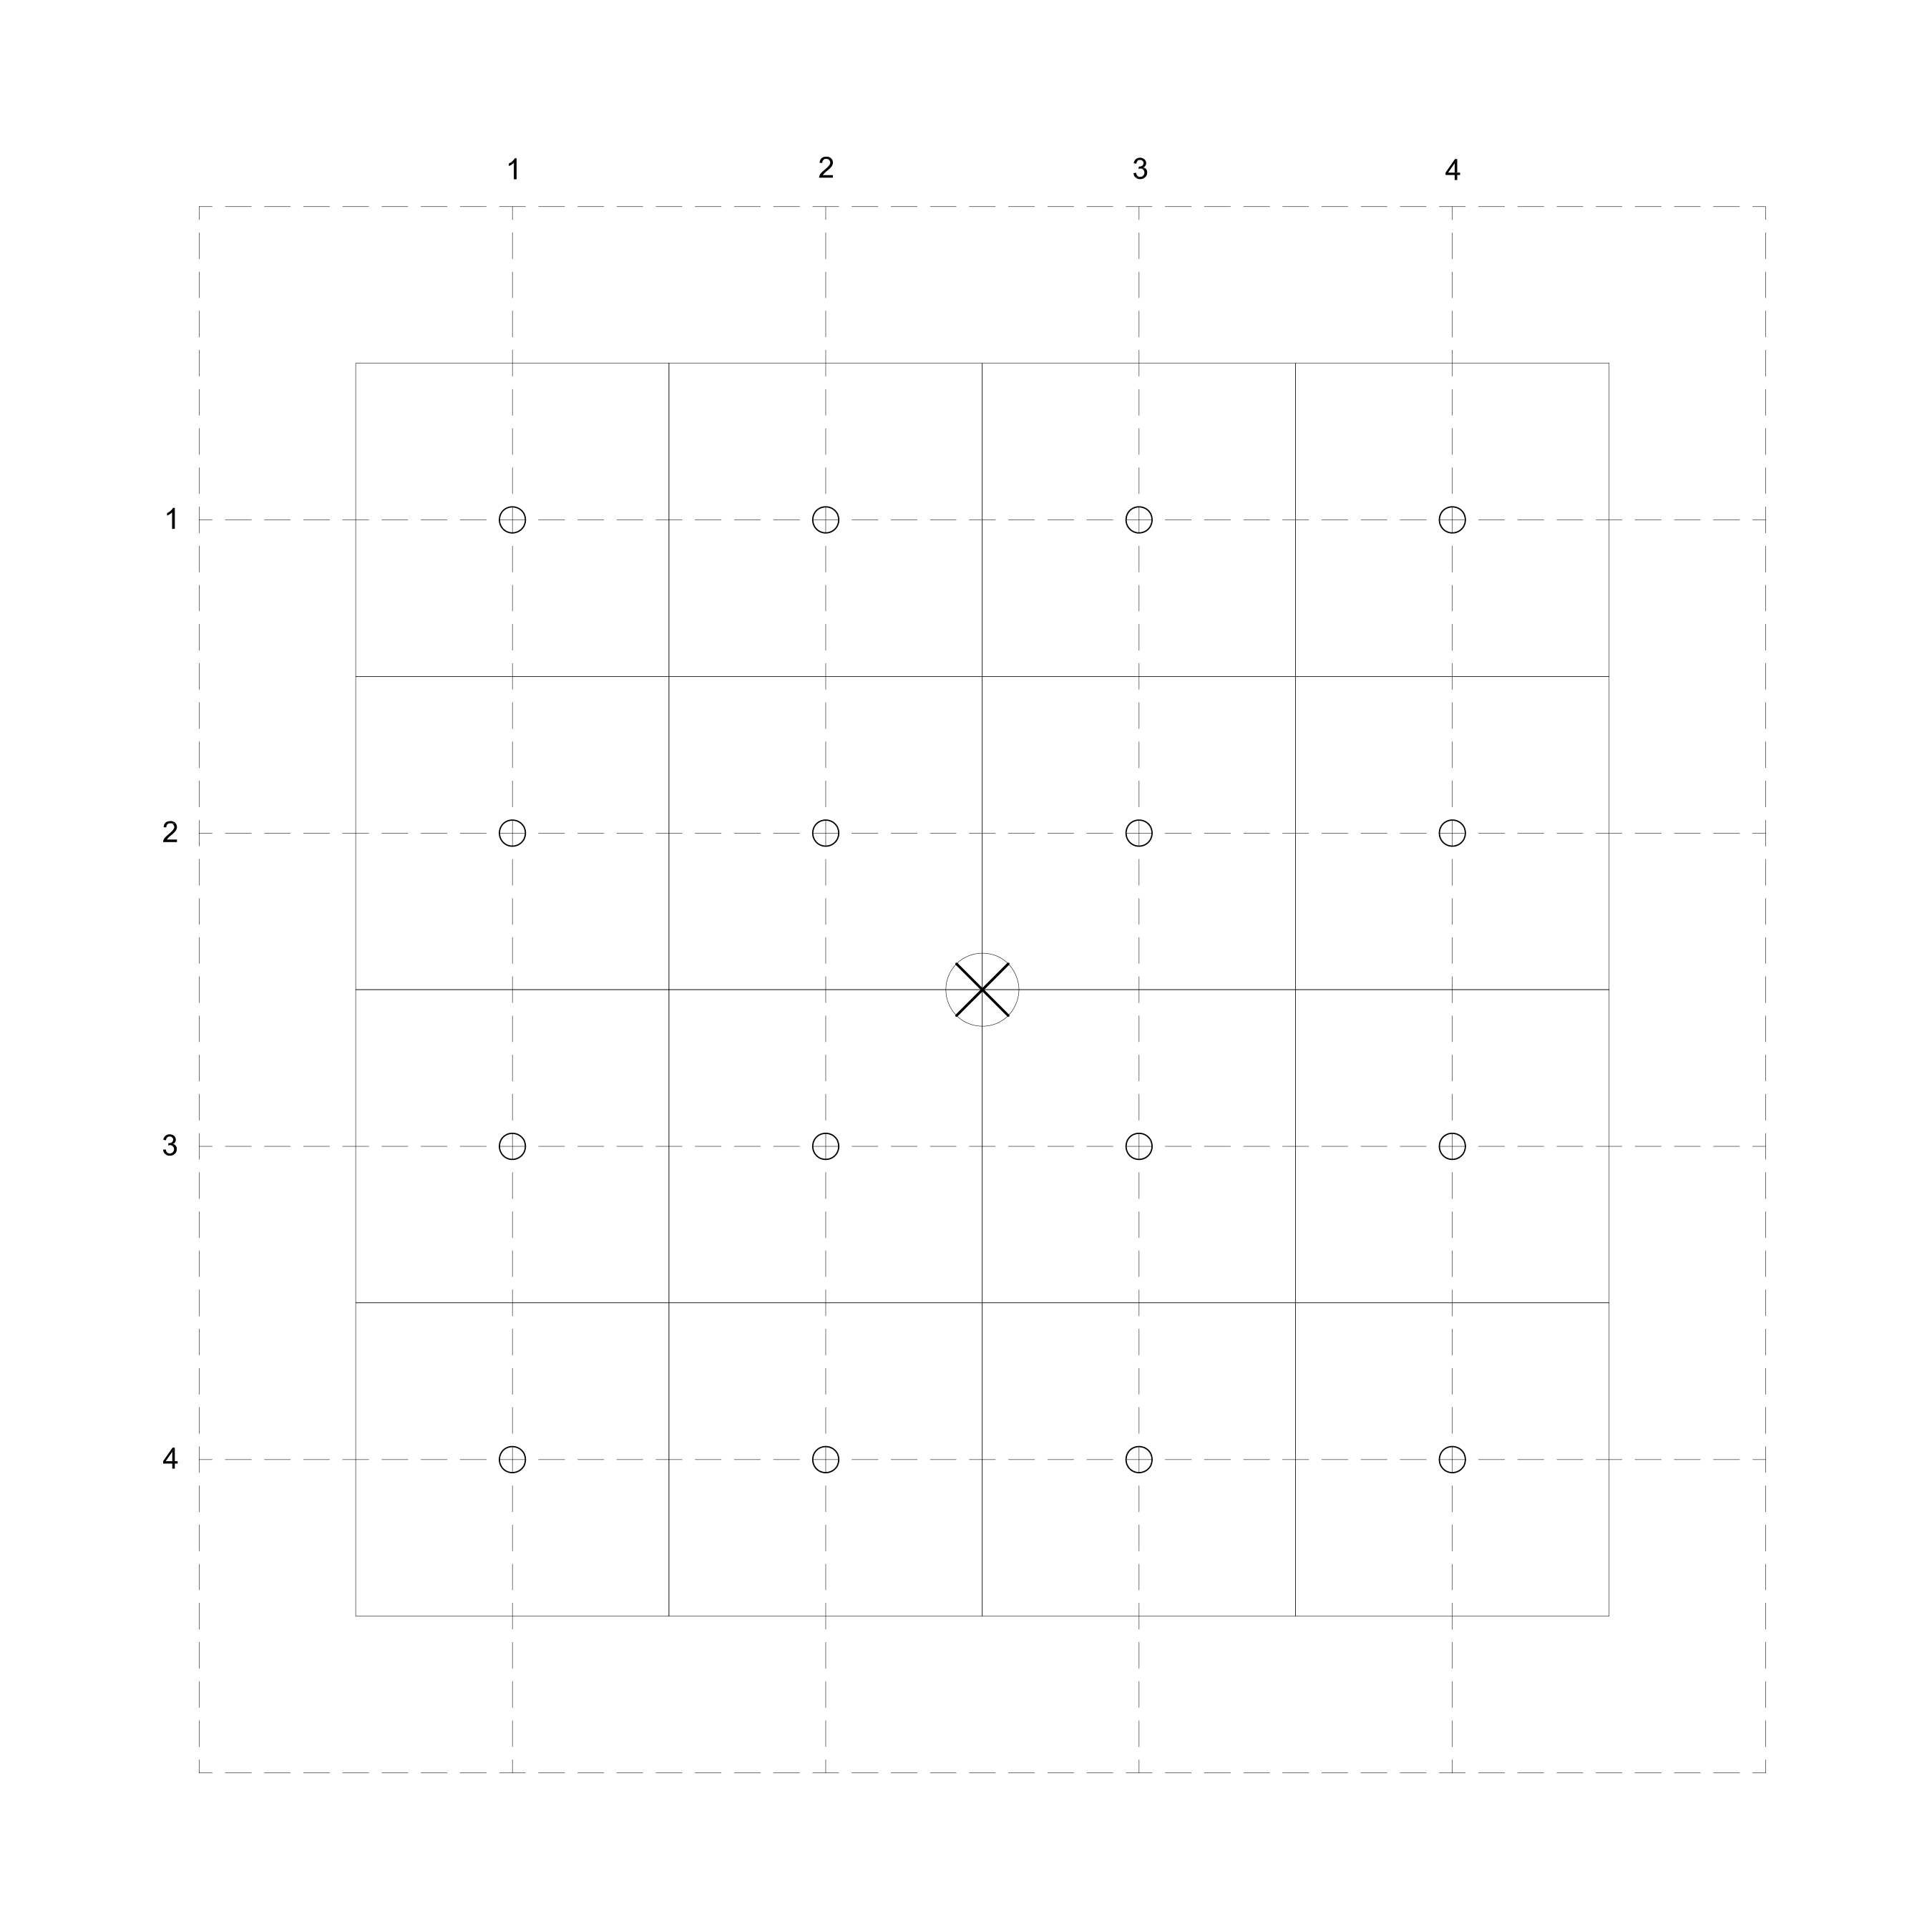
We will now to declare a function that’s argument relies on the use of coordinates rather than separate x and y variables (see Diagram 1).
1
2
3
4
5
6
7
8
9
10
11
12
13
14
15
16
17
18
19
20
21
22
23
24
25
26
27
28
29
30
31
32
33
// Let's declare a function, and let us call that function motorTurn.
voidmotorTurn(intPersonX,intPersonY){// PersonX is a person's location on the x-axis, while PersonY is a person's location on the y-axis.
// As mentioned before, deltaX and deltaY is the difference between the position of a person in relation to the position of the motor.
deltaX=PersonX-MotorX;
deltaY=PersonY-MotorY;
if(deltaX>0){
angleRad=atan(deltaY/deltaX);
}
else{
angleRad=pi+atan(deltaY/deltaX);
}
angleDeg=angleRad *(180/pi);// Let us convert the angle from radians (angleRad) to degrees (angleDeg).
if(angleDeg>180){
angleDeg=-(360-angleDeg);// Now, let us keep the angles between -180 to 180 degrees, for the sake of clarity.
}
Serial.print("Coordinate: ");
Serial.print(PersonX);
Serial.print(",");
Serial.println(PersonY);
Serial.print("Angle: ");
Serial.println(angleDeg);
Serial.println(" degrees");
servo.write(angleDeg);// This should make the Servo rotate.
delay(1000);
}
Diagram 1: Coordinate System
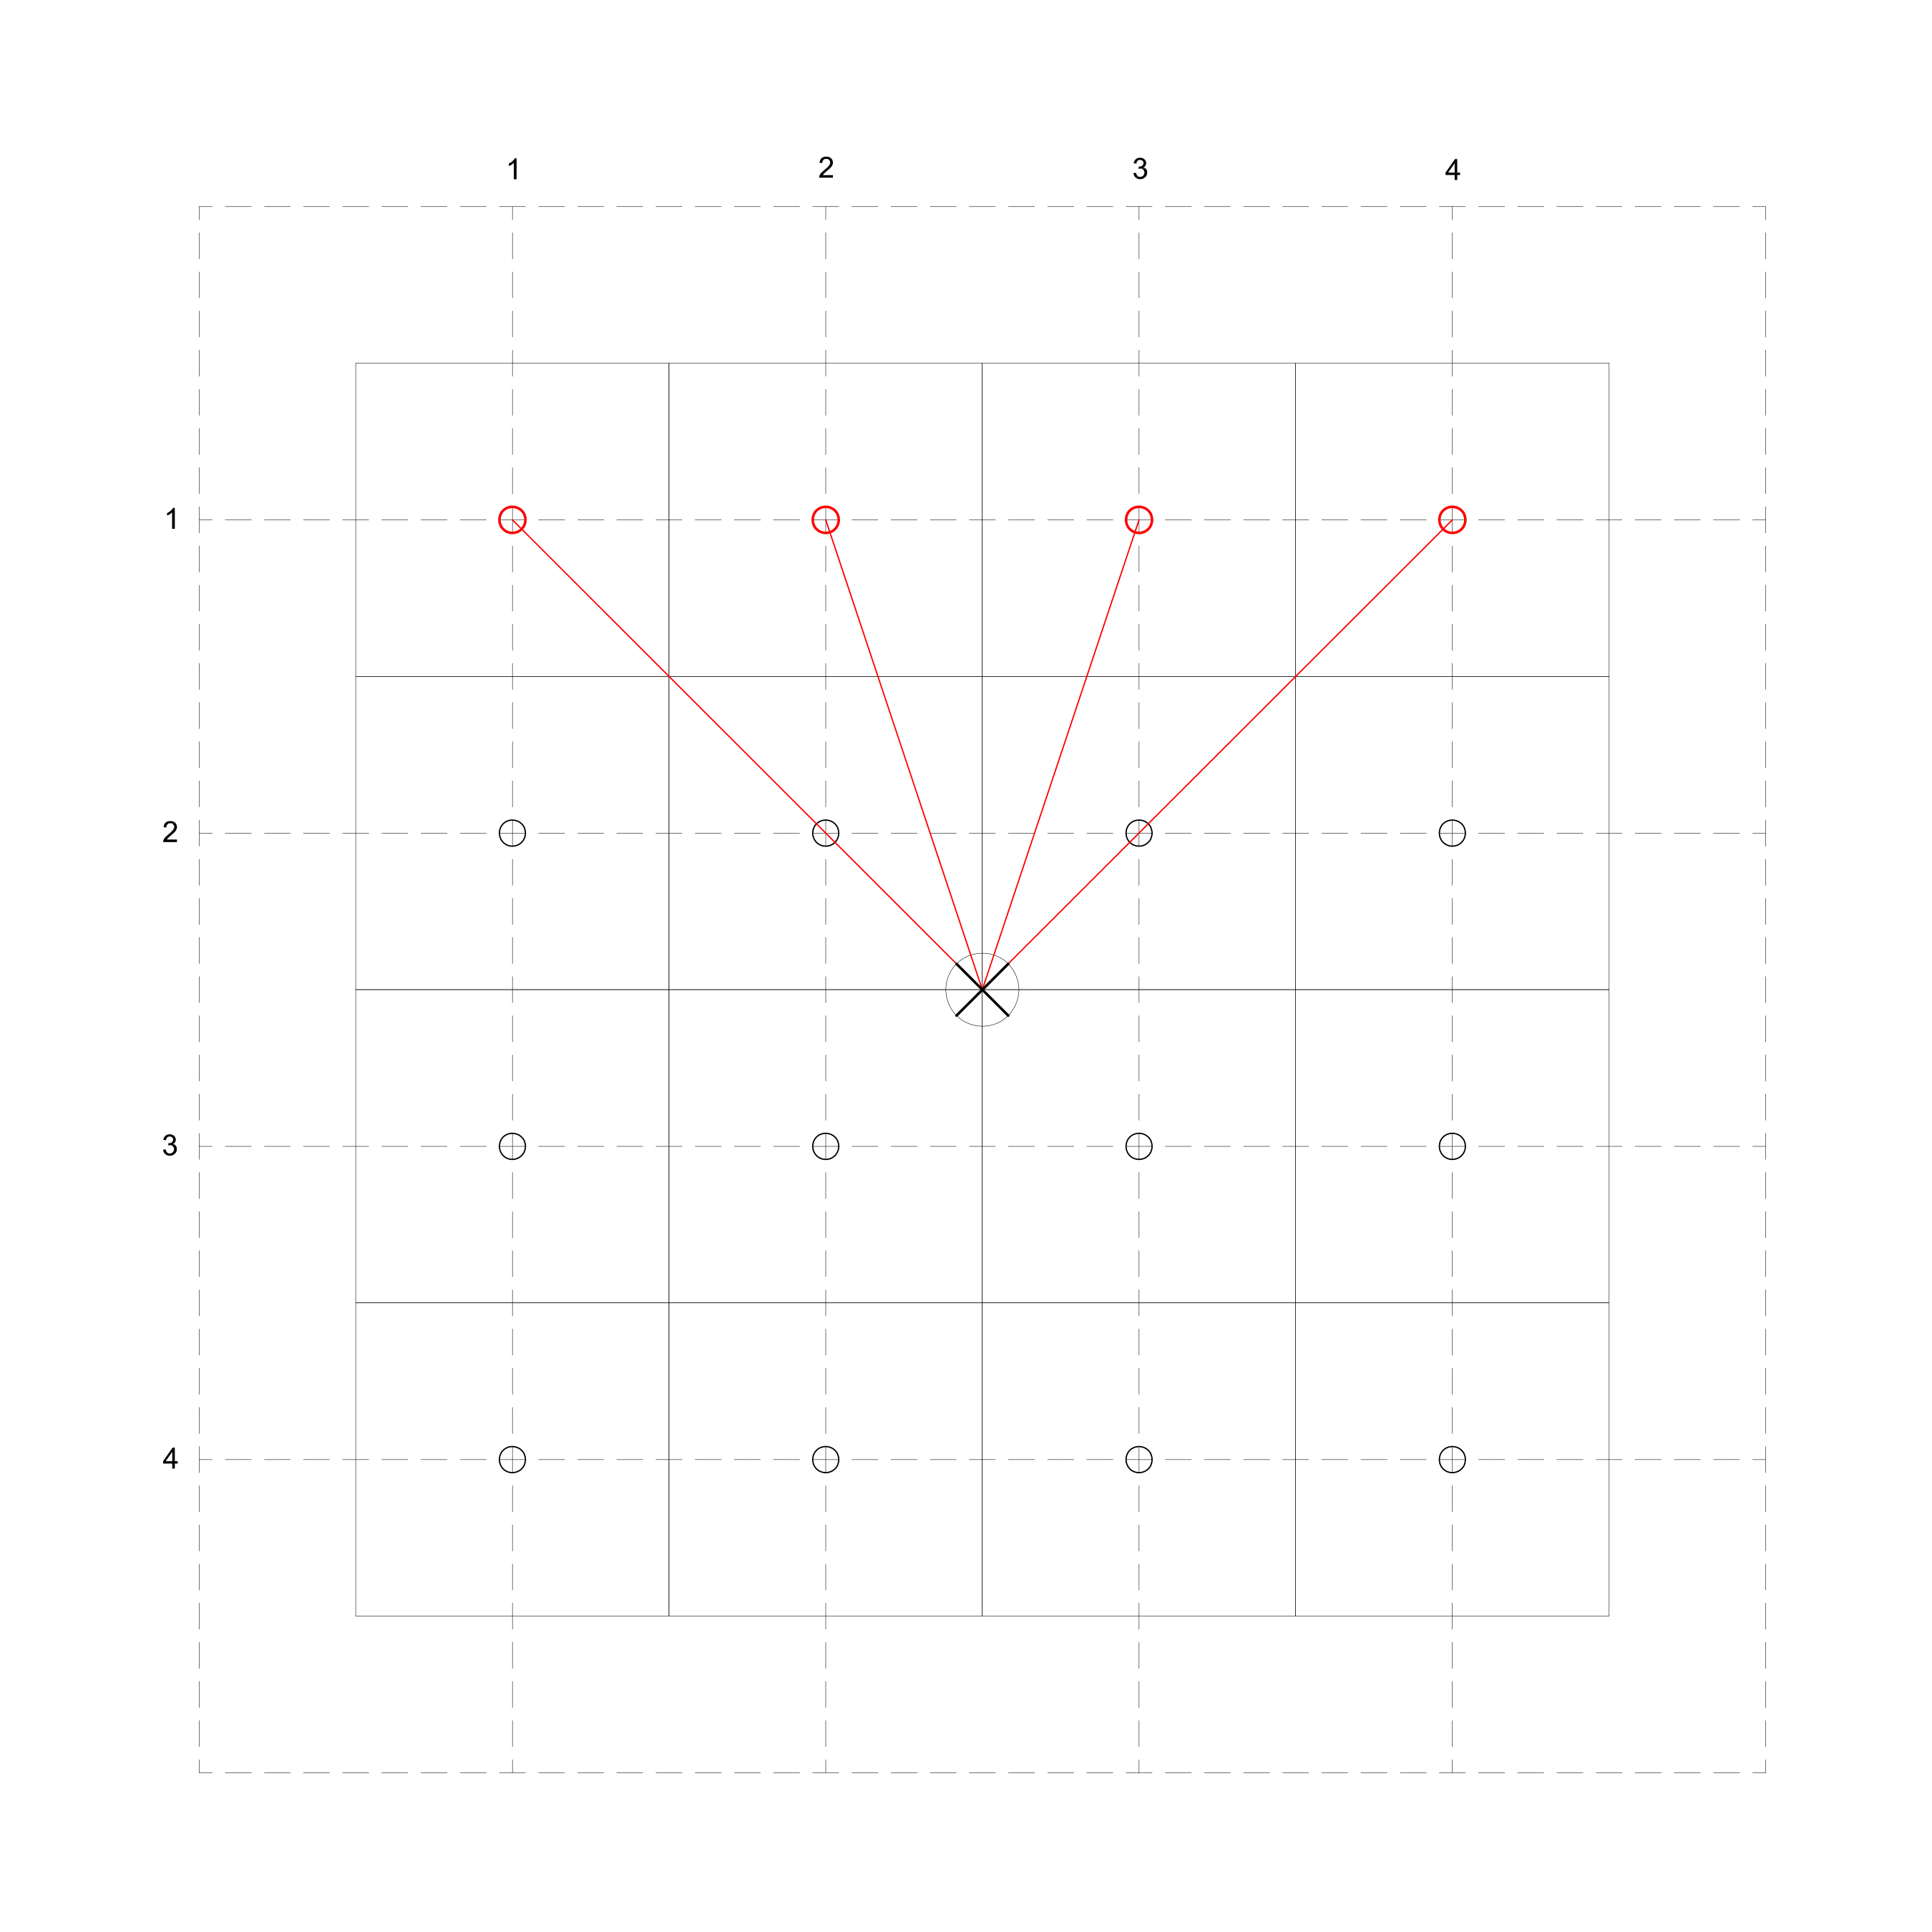
Within the loop function, we will state the position of the motor in relation to the grid (see Diagram 1). Now, we want the motor to angle towards the points located around it (which are diagrammed as circles). In the code below, we will focus on 4 points (see Diagram 2).
1
2
3
4
5
6
7
8
9
10
11
12
13
14
15
16
17
18
19
voidloop(){
// Give the motor a position:
MotorX=2.5;
MotorY=2.5;
// Now give the person a series of positions:
motorTurn(1,1);
delay(1000);
motorTurn(2,1);
delay(1000);
motorTurn(3,1);
delay(1000);
motorTurn(4,1);
delay(1000);
motorTurn(5,1);
delay(1000);
}
// The motor should now rotate towards the position of the person and eventually follow the person through each position within the series provided.
Diagram 2: Angle of Rotation in relation to Person on Grid
Now plug in your Arduino, upload the code and watch your Servo’s arm rotate! You can also check out the angle of the arm in relation to the coordinate in your serial monitor!
If you like, you can expand on this tutorial by including sensors into the equation! Instead of manually giving a set of coordinates, you can collect coordinates through a series of sensors within a built grid. The motor’s arm will rotate to the individual’s position within that grid, thanks to the sensor!
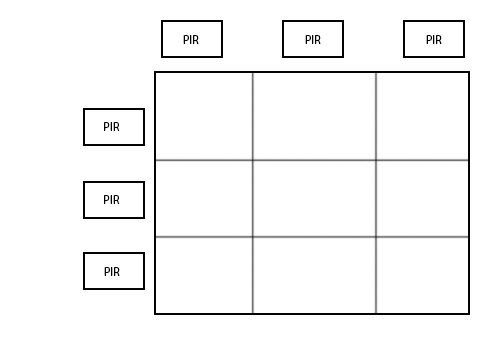
This tutorial will show how to identify the coordinates of the space encompassed by objects within a grid. By using two axes with evenly spaced PIR motion detectors, multiple moving objects can be identified. In addition, when multiple objects are close together in the space, the coordinates will include any area covered on two sides by the objects themselves.
Note: Although this tutorial will use 3 total PIR detectors, the number of sensors can be expanded for larger grids with minimal changes to the code.
Behavior:
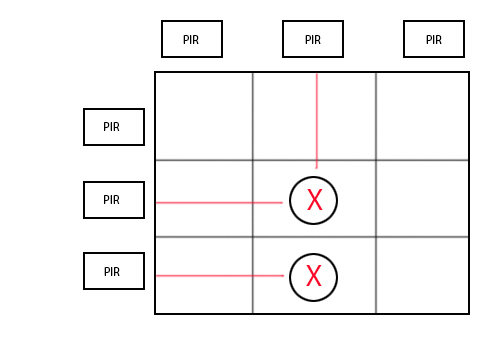
Figure A: Gridded PIR Sensor System
The gridded PIR sensors should be set up as shown in Figure A. In the next few diagrams, the circles represent objects in the grid, and the X’s represent the squares whose coordinates will be returned by Arduino via the serial cable. The red lines show which PIR sensors are set off by the objects.
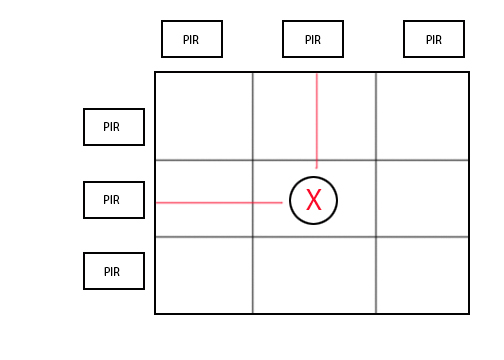
Figure B: One Object Detected
If one object is present in the grid, it will set off PIR sensors attached to the closest column and the closest row.
Figure C: Two objects detected in a line
If two objects in a straight horizontal/vertical line are detected, each object will be detected and the coordinates returned will only be those where the objects are located.
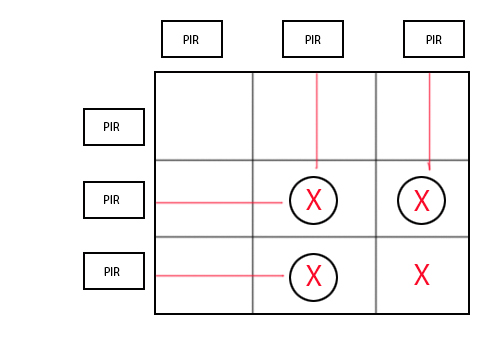
Figure D: Three objects detected (not in a line)
If the objects encompass a certain area on two sides (e.g. if a group of people is walking through a gridded area), the space that they enclose will also be returned as a coordinate value.
This will allow for the response to change when a group enters the space. If the group is neatly ordered in a straight line, the returned coordinates will similarly reflect a straight line. However, if the group is disorderly and spread out in the space, the returned coordinates will reflect the total area encompassed by the group.
Figure E: Objects Along a Diagonal Line
If the objects are placed along the entire diagonal, then all possible coordinates will be returned. According to the initial behavior, each returned value should be encompassed on two sides. In the diagonal case with all coordinate pairs returned, this is technically true, but some of the squares will be two squares or more removed from the actual object, which may encompass more space than desired. In order to fix this problem, additional sensors, such as force sensors on squares outside the diagonal, will provide enough input to double check the presence of objects in those areas.
This is an optional addition, but for our purposes, we will be focusing only on the PIR motion sensors in this tutorial.
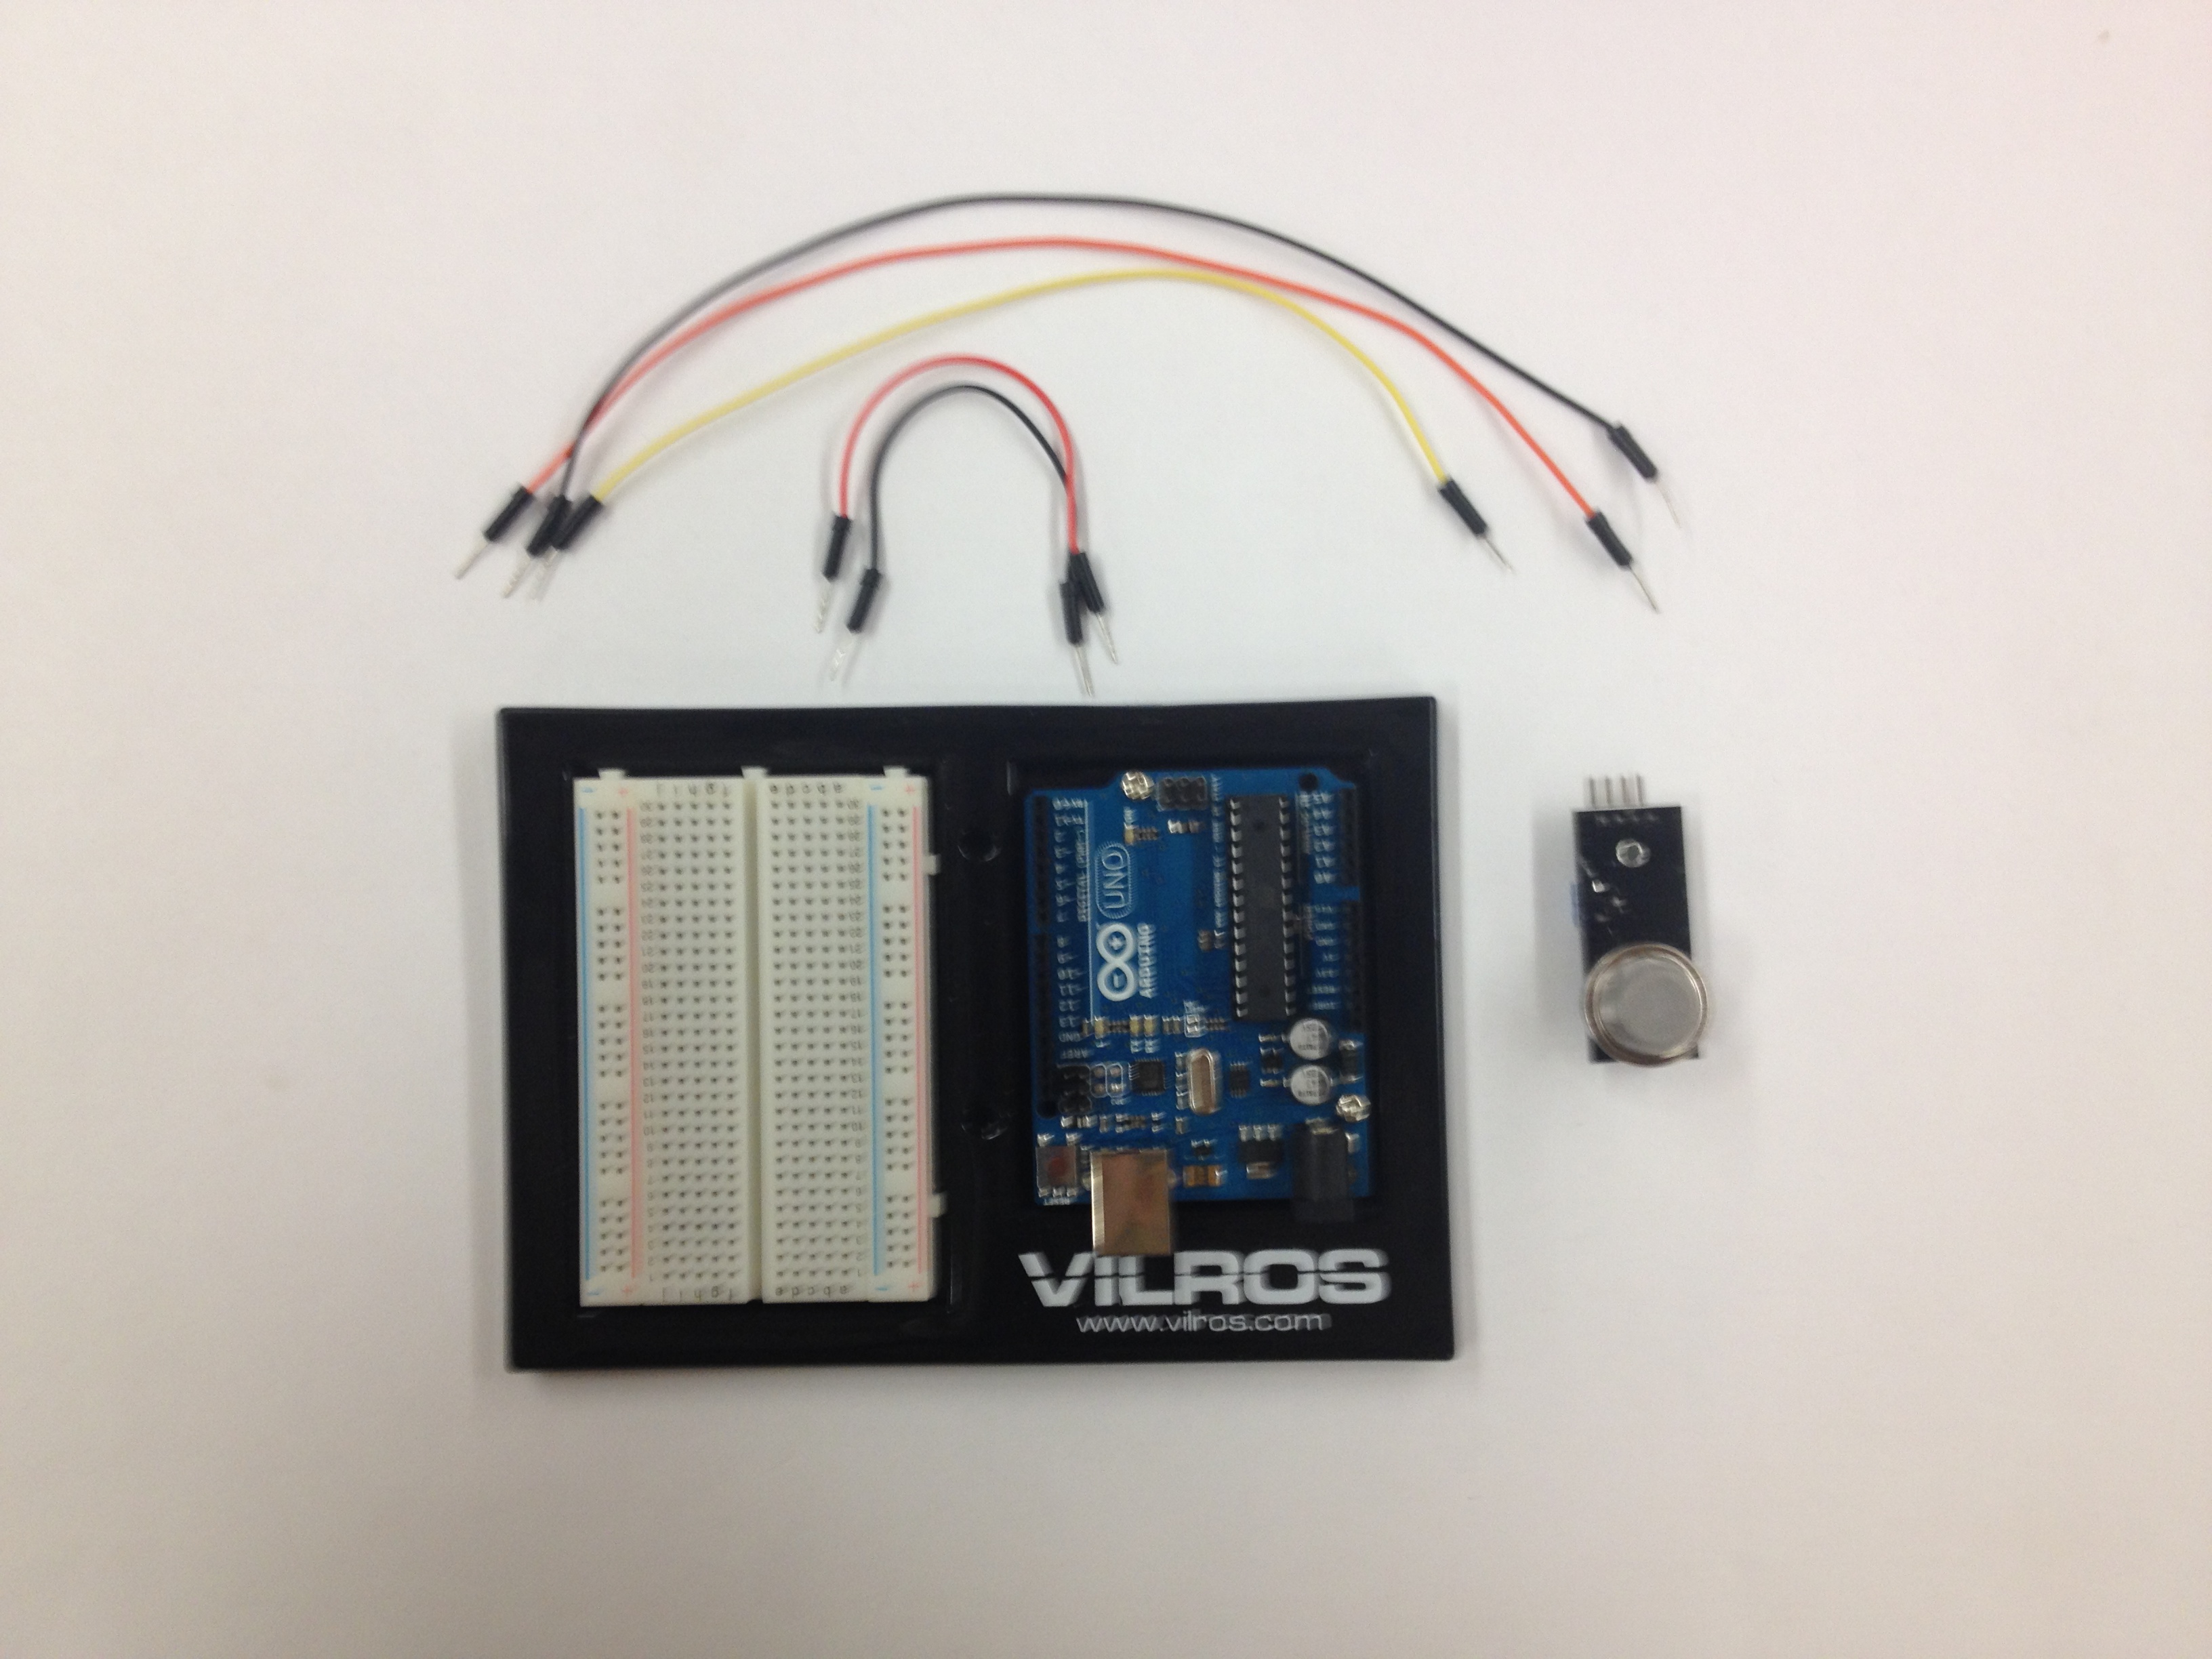
In this tutorial we will be connecting a basic air quality sensor to collect data for other applications with Arduino. There are many sensors you can choose from depending on what gasses or aspect of air quality you are interested in. We were particularly interested in detecting levels of benzene as an indicator of air pollution caused by combustion engines.
For this tutorial we will be using the MQ-135 sensor which detects levels of: NH3, Benzene, Alcohol, NOx, CO2 and smoke.
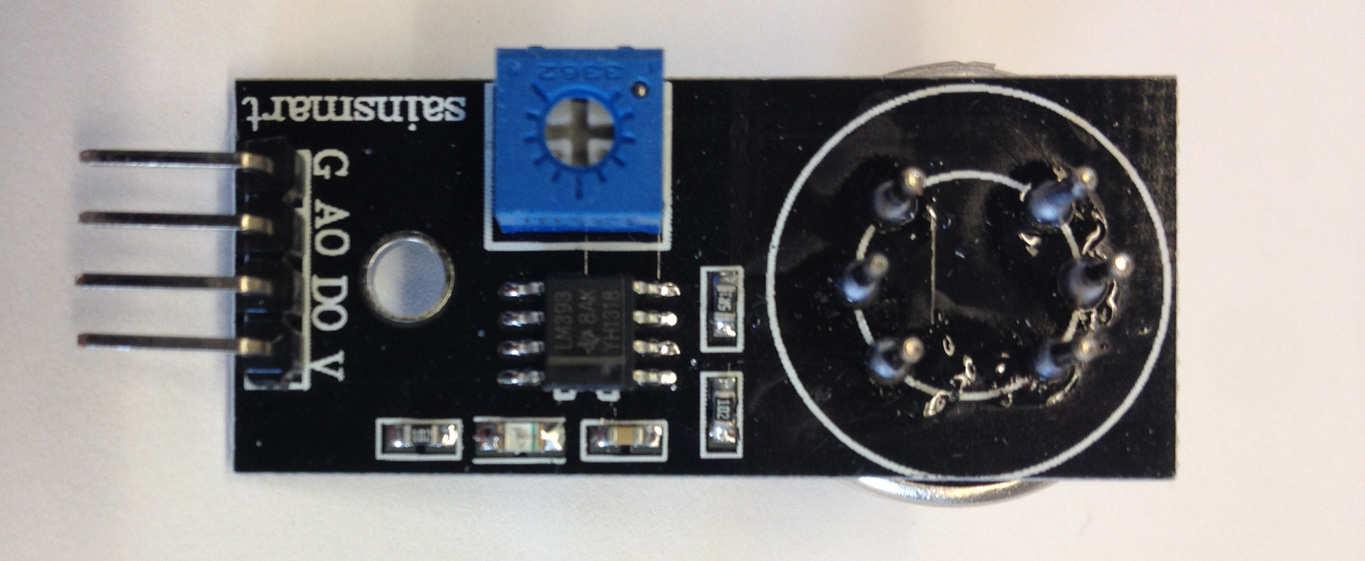
When looking at the sensor there are abbreviations next to the pins you need to wire.
G = Ground
AO = Analog Out
DO = Digital Out
V = Voltage (power source)
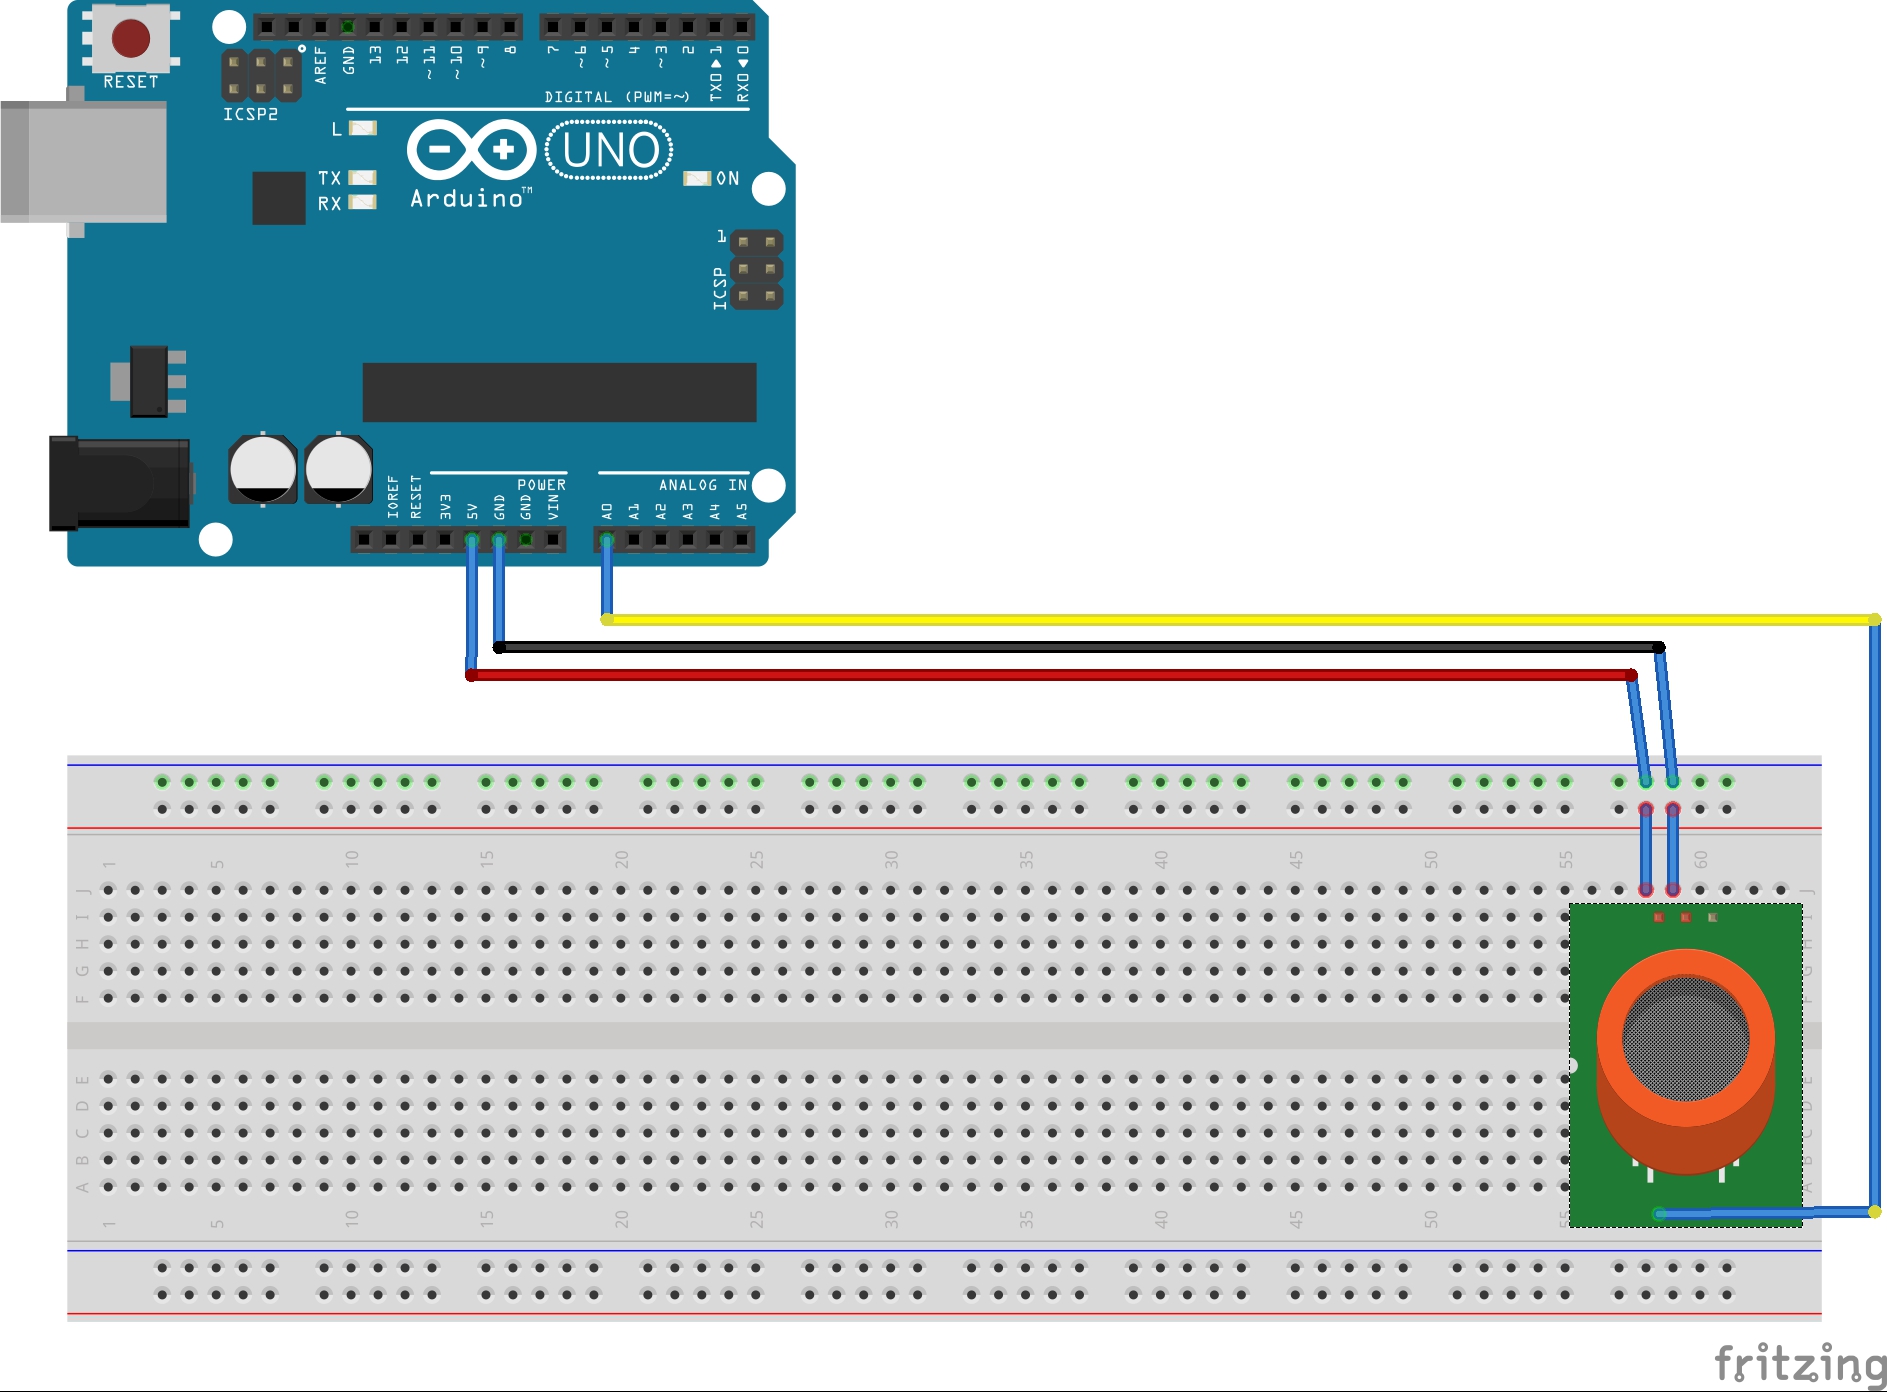
Here is a simple diagram of how your sensor should be wired to your Arduino.
Note: If you are using this particular sensor board you do not need to use a 10 ohm resistor as some of the basic diagrams for this sensor indicate.
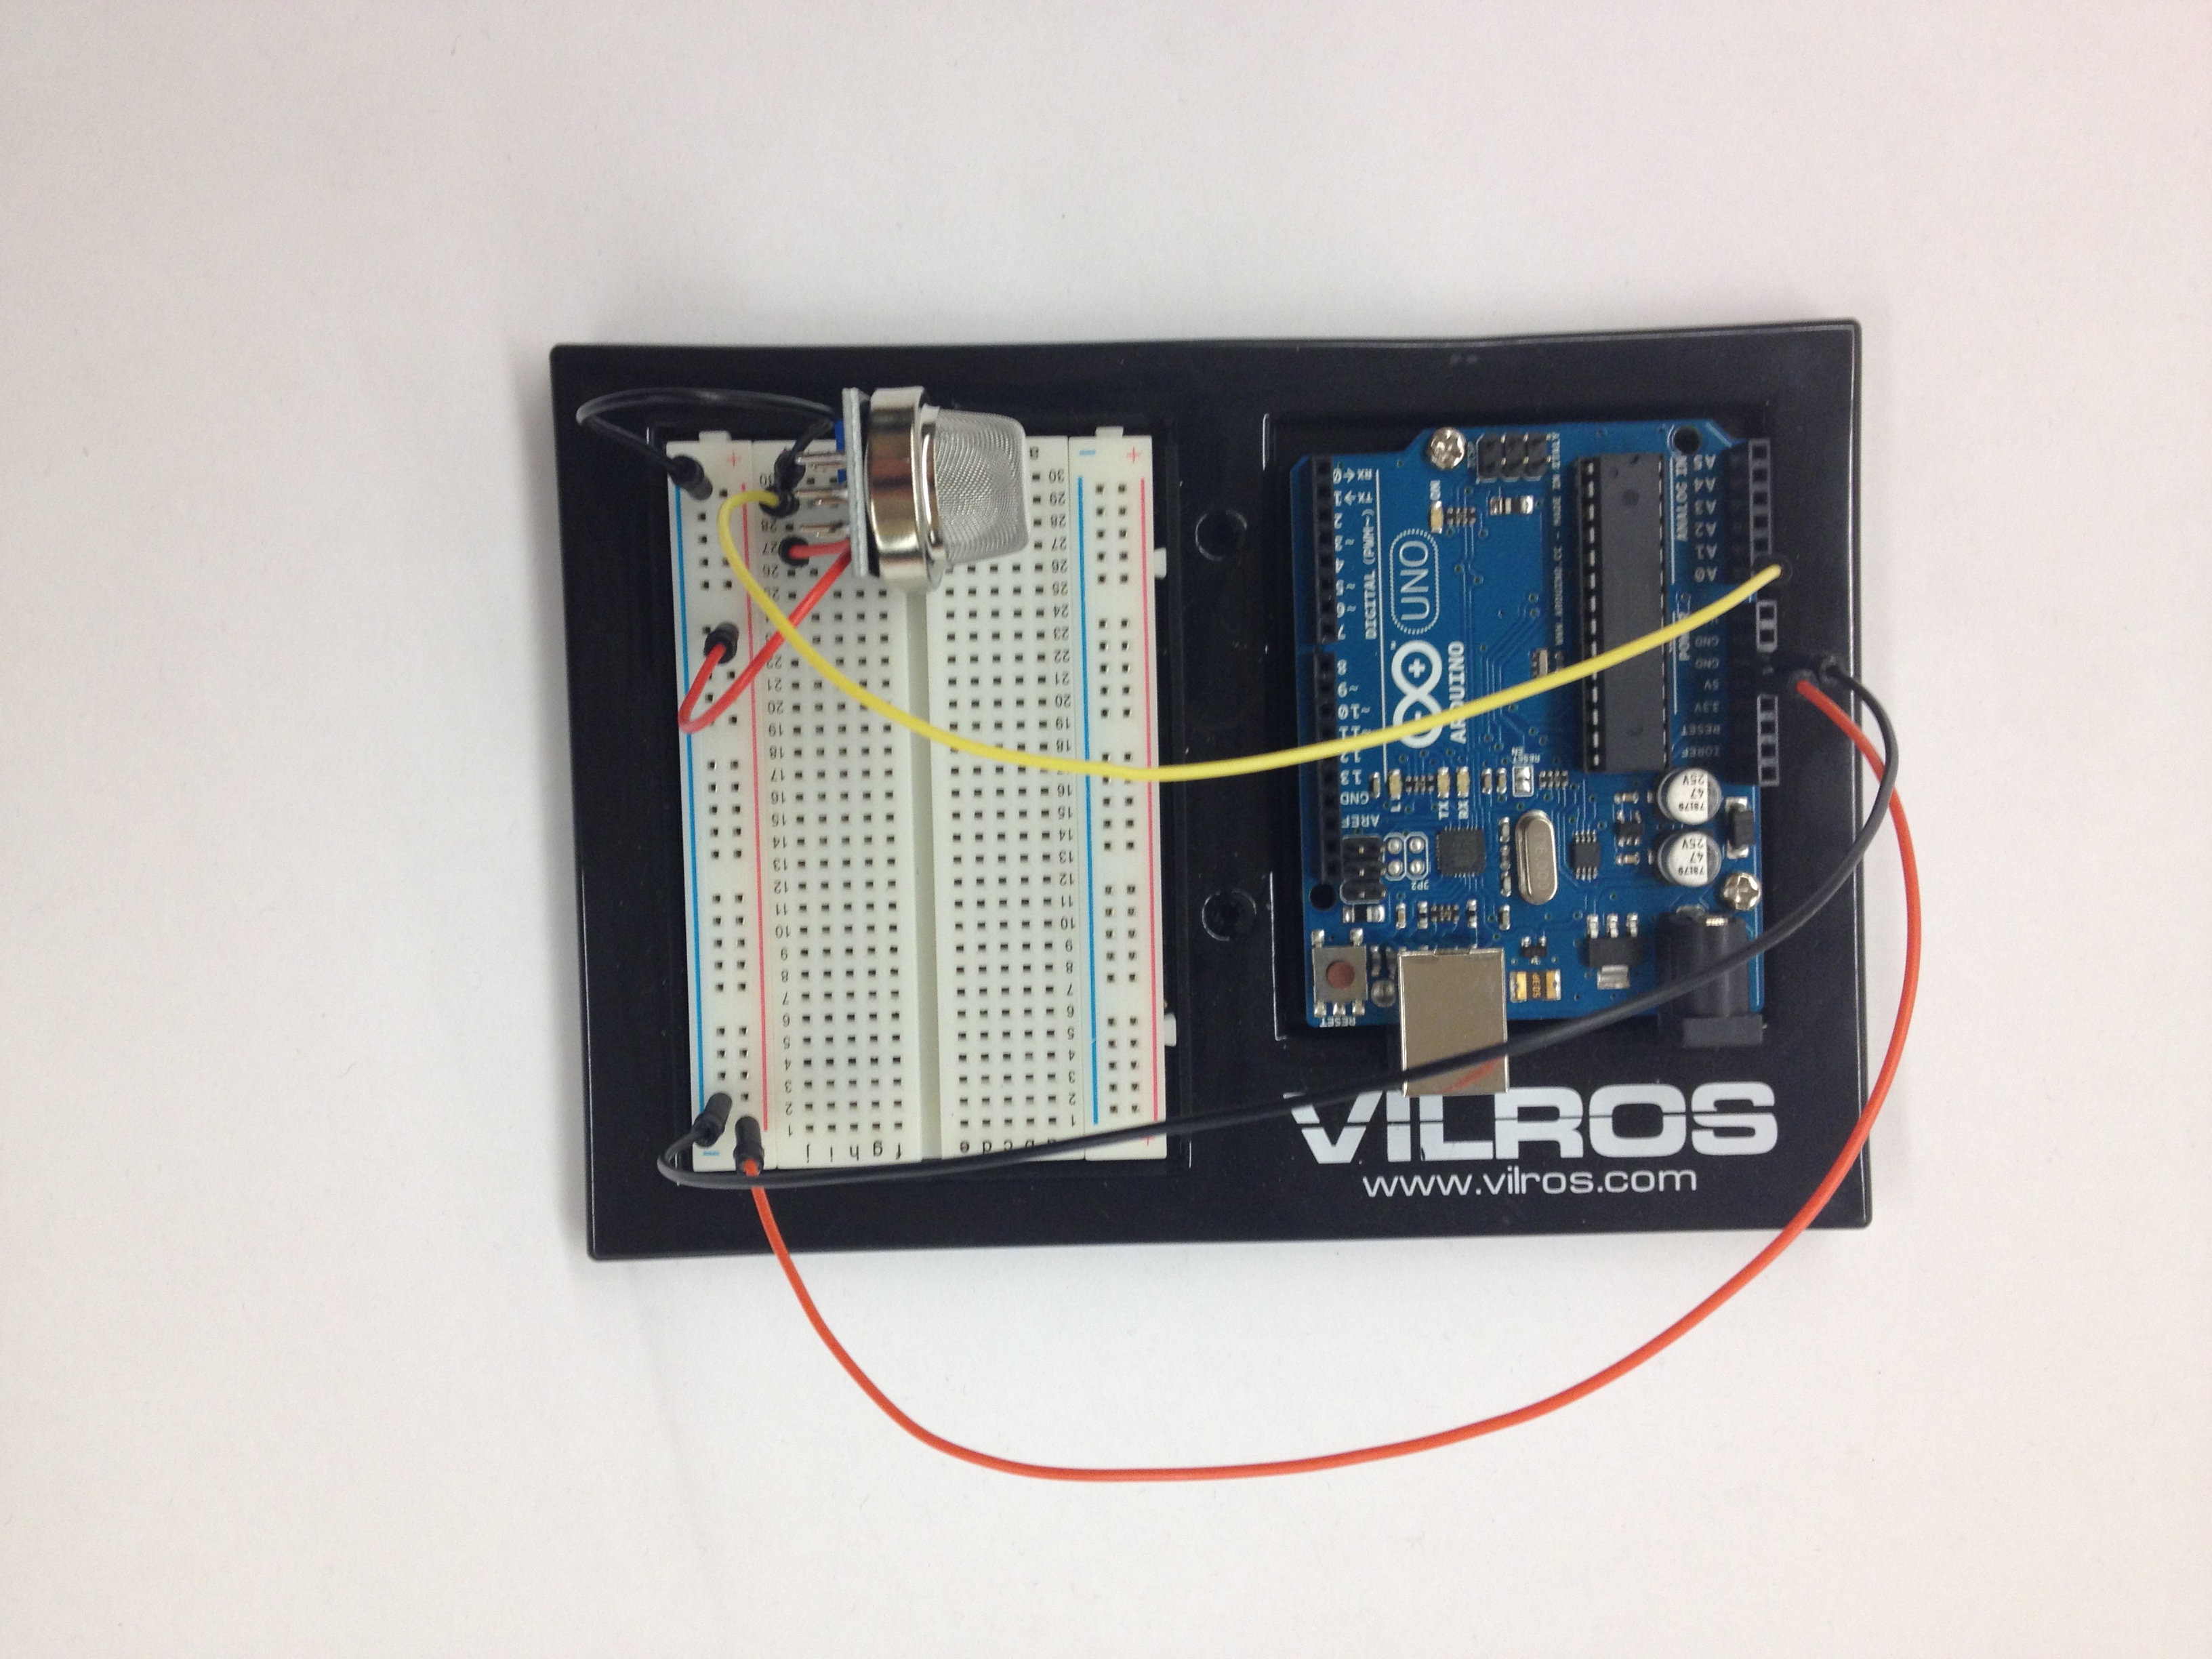
Here we have the sensor set up.
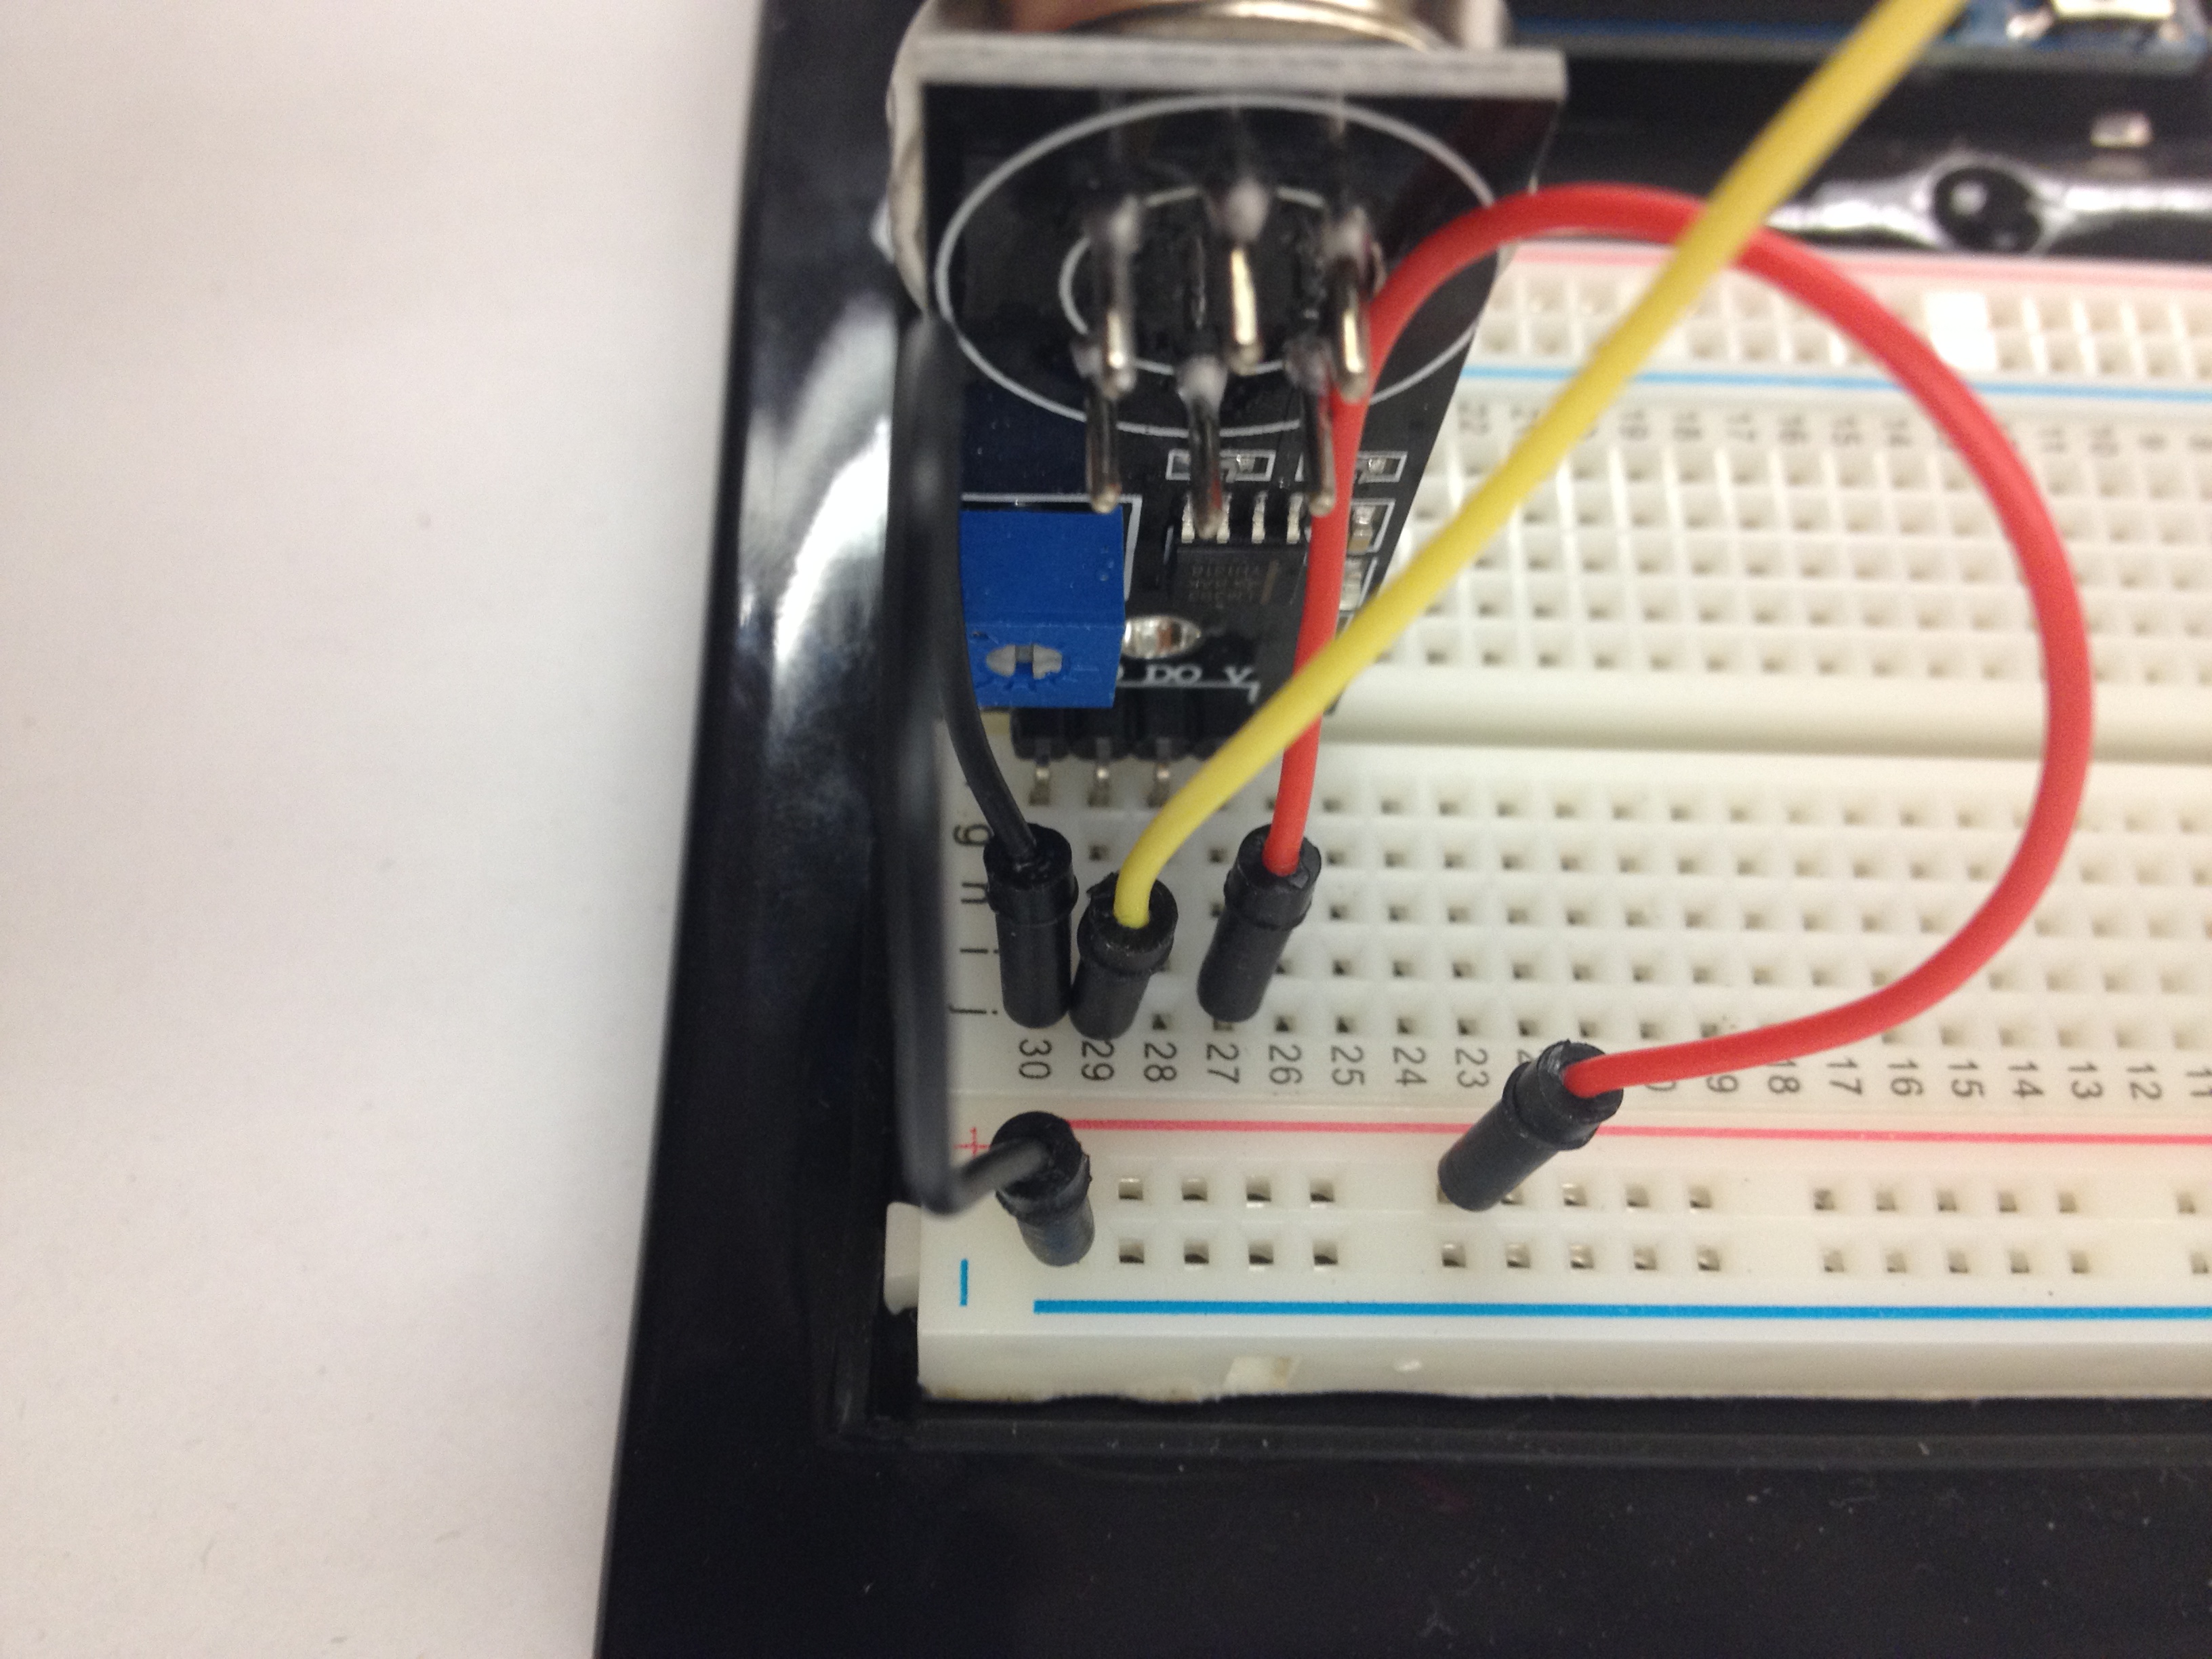
Close up of the sensor and the wiring.
For our power source we used the on board 5V output from Arduino. We wired that to the “V” tab of the sensor board
Next we wired the “G” tab to the ground on the Arduino.
The last step was to wire the Analog Output (AO) to the A0 input on the Arduino.
Code
In our code we wanted to float the voltage readings so that we could eventually use it in Processing applications.
We also wanted to convert the voltage readings of 0-1023 from the sensor to a 0.0-5.0 value which would reflect the true voltage being read.
1
2
3
4
5
6
7
8
9
10
11
12
13
14
15
16
17
18
19
20
21
22
23
24
25
constintgasSensor=0;
voidsetup()
{
Serial.begin(9600);// sets the serial port to 9600
}
voidloop()
{
floatvoltage;
voltage=getVoltage(gasSensor);
Serial.println(voltage);
delay(1000);
}
floatgetVoltage(intpin)
{
return(analogRead(pin)*0.004882814);
// This equation converts the 0 to 1023 value that analogRead()
// returns, into a 0.0 to 5.0 value that is the true voltage
// being read at that pin.
}
Run this code to your Arduino and you will be ready to detect changes in the level of detectable gasses!
Notes:
After doing some research about this sensor it was discovered that while the MQ-135 can detect all of the gasses listed above, it cannot distinguish between them. If you are looking to specifically target one gas, it might be better to find a different sensor.
This sensor also needs uses a heater to warm up the sensor. It has been advised to not use this with a small battery source as it will quickly drain your battery.
This tutorial allows you to turn environmental data, in this case the amount of light in the setting you are working in, into an on/off switch for LED lights. This tutorial is a precursor to a more complicated setup that will be deployed for turning data gathered by a weather shield into conditions for selecting functions on a Raspberry Pi.
Tutorial Parts List:
Arduino UNO (1)
Breadboard (1)
Photo resistor (1)
Jumper wires (7)
10k Ohm resistor (1)
330 Ohm resistor (2)
Red LED (1)
Yellow LED (1)
Arduino Setup:
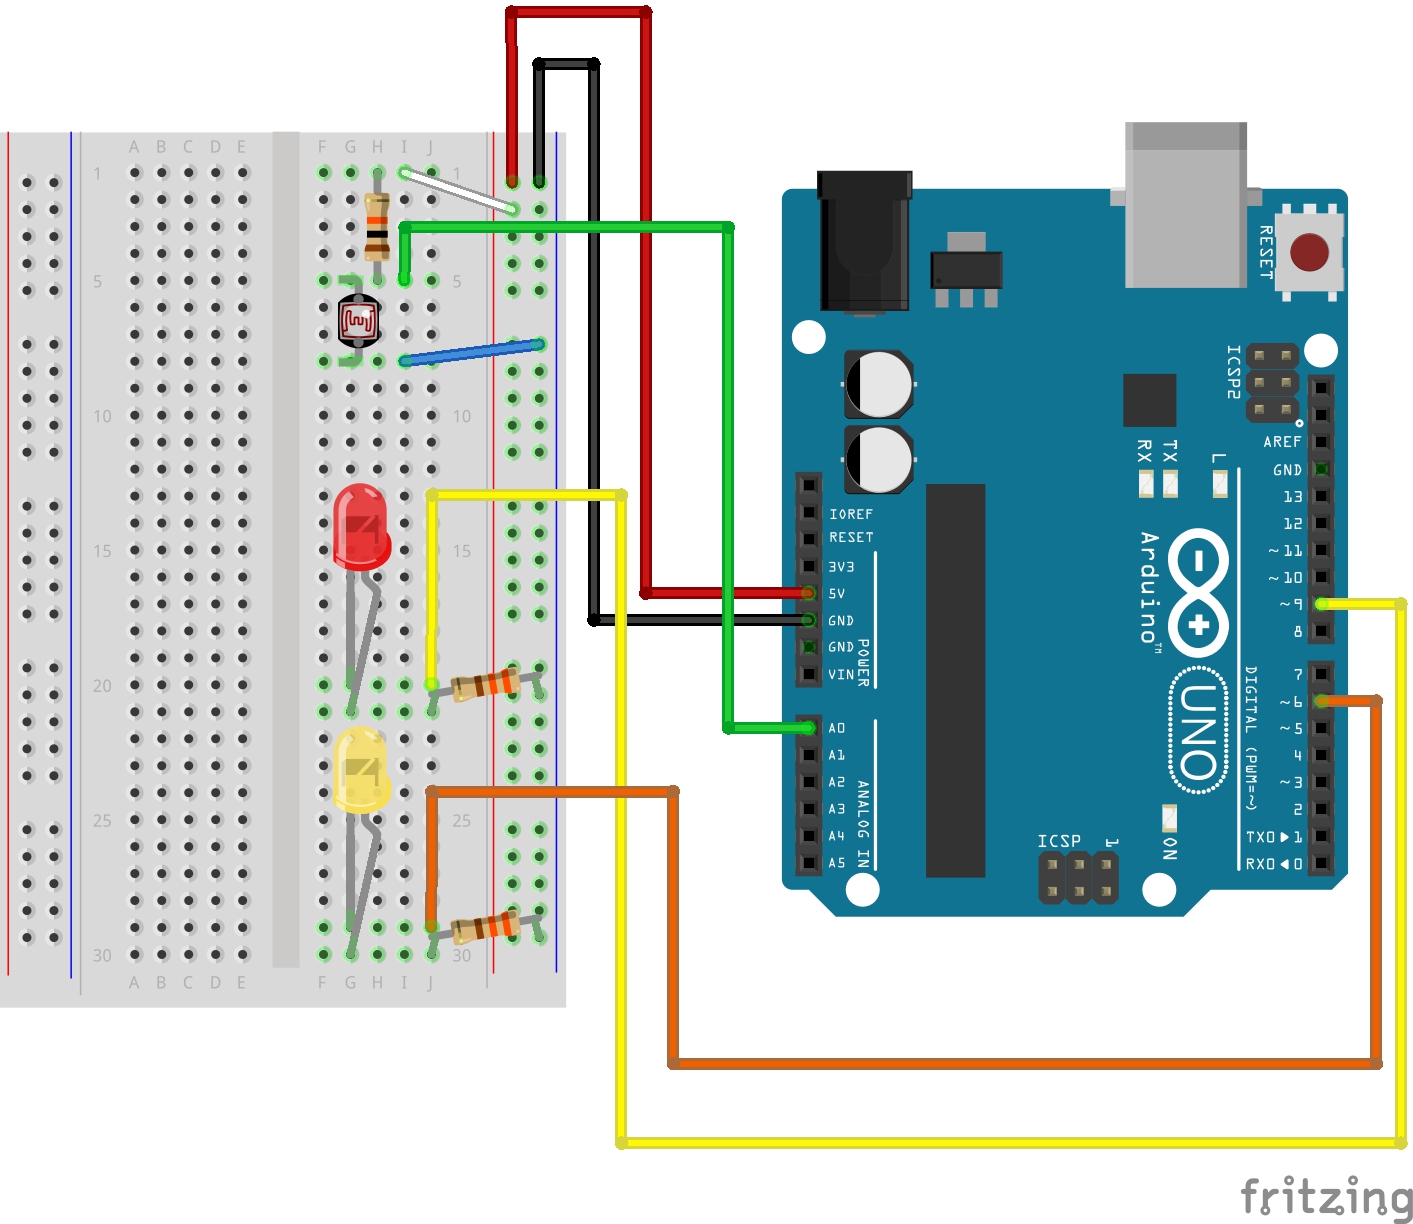
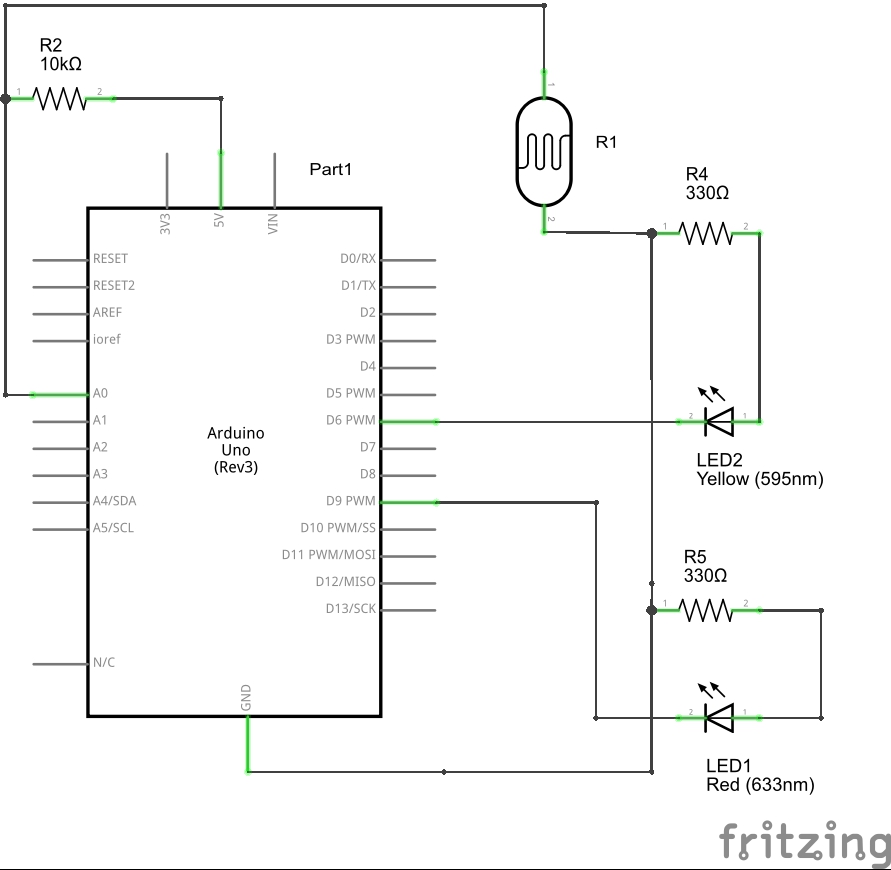
Let’s start by setting up the hardware on our Arduino board. Note: the short leg (the negative side) of the LED lights should be below the long leg (the positive side) in this setup. Use the following diagram to guide your setup:
You may also find the following circuit diagram helpful for your setup:
Coding:
Once you have your board set up, it’s time to enter our code into Arduino. What we are looking to accomplish here is getting our Arduino to sense the level of light in the environment, and use that input to determine which LED light should turn on or off. This tutorial could be altered in many ways, you could use only one LED, and simply have that light turn on/off according to light level. You can also alter the level of brightness/darkness Arduino will use to determine whether the LED(s) should be turned on or off.
1
2
3
4
5
6
7
8
9
10
11
12
13
14
15
16
17
18
19
20
21
22
23
24
25
26
27
28
29
30
31
32
33
34
35
36
37
38
39
40
41
42
43
44
45
46
47
48
49
50
51
// Tutorial: How to turn environmental light conditions into a LED power switch
// First we need to declare constants to name the pins we will be using.
// This will allow us to call our pins by name in the sketch.
constintsensorPin=0;// Our photo resistor must connected to an analog pin (A0)
constintredledPin=9;// Our red LED pin
constintyellowledPin=6;// Our yellow LED pin
constintswitchPoint=200;// Here we must declare a value to act as our switching
// point to determine when to turn the LEDs on and off
// playing with this value will change how dark or light
// must be for the lights to switch on/off. Pick a value
// between the range of 0 and 255.
intlightLevel;// Declare a global variable for light level
voidsetup()
{
pinMode(redledPin,OUTPUT);// First we need to set up both LEDs to be outputs.
pinMode(yellowledPin,OUTPUT);
}
voidloop()
{// To begin our void loop, we tell Arduino to determine
// the value of lightLevel by using the analogRead()
// function. This function measures the incoming voltage
// from the photo resistor (connected to our sensorPin.)
// The photo resistor relays this information to our analog
// pin in a range of 0 to 1023 (0 to 5 volts).
lightLevel=analogRead(sensorPin);
// Next we must create an if/else statement to set up the
// parameters for our switch. In this case, we are telling
// Arduino that if the lightLevel is less than the value of
// our switch point, keep the red LED off and turn the yellow
// LED on.
if(lightLevel<switchPoint)
{
digitalWrite(redledPin,HIGH);
digitalWrite(yellowledPin,LOW);
}
// if the lightLevel does not represent the above condition
// (if the lightLevel is greater than the value of the
// switchPoint) then the red LED will turn on and the yellow
// LED will turn off.
else
{
digitalWrite(redledPin,LOW);
digitalWrite(yellowledPin,HIGH);
}
}
The following video illustrates what you should see when you are finished! I used a small keychain light to demonstrate the change of the LED lights under different light conditions. As mentioned earlier, you can alter the light level needed to switch the LEDs on/off in the code.